This is part 2 in a series on monitoring Kubernetes. Check out parts 1, 3, and 4.
In part 1 of this series, I discussed the rise of microservice architecture and the reliance on Kubernetes and Docker for container orchestration and management. I also shared some of the challenges these new technologies present and what sources of data we need in order to effectively monitor our Kubernetes environments. In my concluding comments, I mentioned that Prometheus provides an excellent starting point for collecting and analyzing this data. In this post, I’ll give a brief overview of Prometheus, illustrate how to collect Kubernetes data with Prometheus, and discuss some of the pros and cons of the Prometheus approach.

In the next installment of this series, I’ll address some of those cons, illustrating how Sensu and Prometheus are complementary.
Prometheus: a brief overview
Prometheus is an open source monitoring tool originally built at SoundCloud. Now a standalone open source project, Prometheus followed in Kubernetes’ footsteps to join the Cloud Native Computing Foundation (CNCF) in 2016.
One of the most unique attributes about Prometheus is that it uses a pull-based architecture — as opposed to pushing metrics to the monitoring tool, it pulls metrics from services. Prometheus also has a pushgateway, meaning it does support “push” for certain metrics for when the pull model doesn’t work.
One of the most interesting things about the Prometheus pull-based model is the dependency on “metric exporters,” which are used to expose metrics for services and systems. Prometheus exporters can be standalone applications (akin to single-purpose monitoring agents), or they can be built into your applications and services via language-specific client libraries (like a modern APM solution).
Prometheus components include:
- The main Prometheus server, which includes a retrieval/collection component for collecting metric data from your services and systems (i.e., from various Prometheus exporters); a time-series database (TSDB) for storing data; and an API for querying stored data
- Alertmanager, the alert engine
- Pushgateway for pushing select metrics into Prometheus
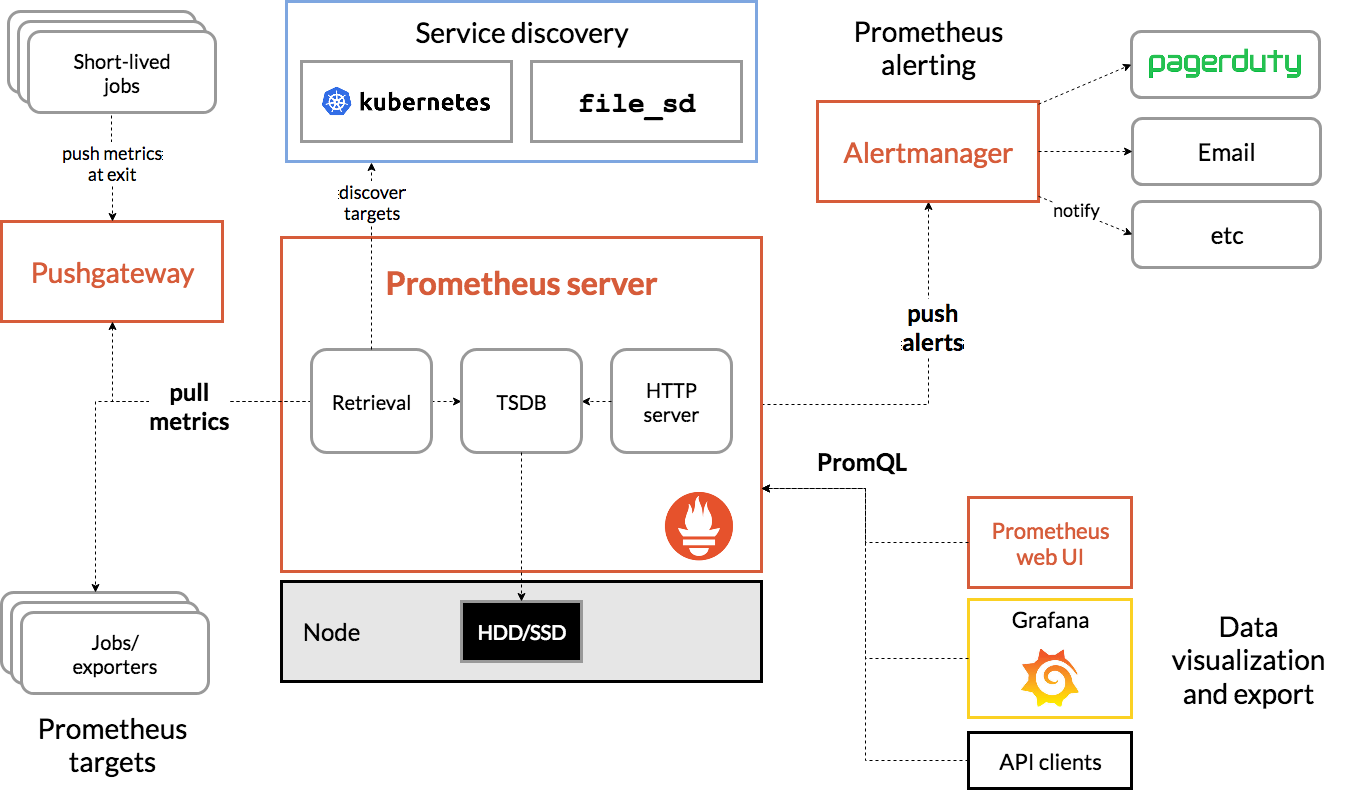 Prometheus architecture and ecosystem components. Source.
Collecting Kubernetes data with Prometheus
There’s a Kubernetes operator that’s been created for Prometheus, which automates a majority of the deployment process. If you’re going to use Prometheus for monitoring Kubernetes, use the operator. A related project called kube-prometheus offers a packaged solution for deploying and managing Prometheus on Kubernetes, combines the Prometheus operator with a collection of manifests that includes pre-configured Grafana dashboards and a few Prometheus exporters. By itself, the operator doesn’t really deploy a complete monitoring solution; kube-prometheus takes it one step further by being prescriptive in what you monitor and how. And — in addition to pre-configuring alertmanager — it automatically deploys kube-state-metrics, which is pretty rad. Effectively, you can run this one sweet command to get started with Prometheus on Kubernetes.
Here are the steps we recommend for collecting Kubernetes data with Prometheus:
- Use kube-prometheus to deploy Prometheus and set up metric collection from the sources mentioned in part one.
- Instrument your applications with the Prometheus instrumentation libraries.
- Label your applications on Kubernetes to identify their Prometheus metrics scrape targets exposed in step two.
- Set up alertmanager rules, to alert when certain conditions are met for either the Kubernetes cluster state or your applications.
Note: this is by no means a full Prometheus installation guide (Prometheus has its own). kube-prometheus is a packaged solution for monitoring Kubernetes and your labeled applications but it’s just a starting point.
Prometheus monitoring: strengths and limitations
Now that I’ve given you a sense of how to monitor Kubernetes with Prometheus, I’ll lay out the benefits and shortcomings of Prometheus for monitoring.
The benefits of Prometheus include:
- Tight integration with Kubernetes (due to the built-in exporters), coupled with the fact they’re both CNCF projects, often makes Prometheus the go-to for monitoring Kubernetes.
- Open source projects like the Prometheus operator make operation less burdensome.
- The query language and API are fast and easy to use.
- There’s a good number of exporters and libraries available for collecting application metrics.
- A good selection of community-developed exporters that extend the coverage of what Prometheus can monitor.
- Prometheus’ pull-based model of collecting time-series data provides a standardized approach, and therefore simplifies data collection.
The fact that Prometheus’ data collection model defaults to time series presents a double-edged sword: on the one hand, you can easily standardize collecting data in a particular way, which helps simplify things; on the other, you’ve now limited yourself to a constrained data model that might be missing some context.
This leads me to the cons of Prometheus:
- As with any pure-telemetry monitoring solution, you miss out on context with the simplified, constrained data model. Because all data must be represented as a measurement, it affects how you represent certain pieces of data.
- You also get limited granularity with the pulled-based model, because the exporters provide summarized data, which is only scraped periodically.
- While great for Kubernetes, Prometheus is not designed for monitoring legacy or multi-generational infrastructure. One reason for this is because it’s a pull-based system, requiring you to punch holes in the firewalls in traditional networks.
- For ephemeral infrastructure, Prometheus uses a set of discovery libraries to stay up to date with the platforms it monitors (such as Kubernetes). This method introduces a degree of lag as resources come and go, which in turn is exaggerated by metric scraping intervals.
- The Prometheus collection is also unauthenticated and unencrypted. So, if anything has access to the network, it can observe your telemetry data (this includes metric labels — you add labels for context, but then that context would be out in the open).
Next up: Sensu + Prometheus for comprehensive monitoring
In my next post, I’ll share best practices for monitoring your applications running on Kubernetes (including the daemonset and sidecar pattern), show how to use Sensu to scrape Prometheus metrics, and address the cons outlined above — illustrating how Sensu and Prometheus are complementary, forming a comprehensive solution for monitoring Kubernetes and the applications running on it.

Made with #monitoringlove by SensuTM in Canada 🇨🇦 and the USA 🇺🇸. © 2017-2021 – Privacy Statement – Terms & Conditions