This is part 3 in a series on monitoring Kubernetes. Check out parts 1, 2 and 4.
In part 1 of this series, we discuss the rise of Kubernetes and Docker for containerization and container orchestration. I also shared some of the challenges these new technologies present and what sources of data we use to monitor Kubernetes. Part 2 dives into collecting Kubernetes data with Prometheus, plus the pros and cons of that approach. As promised in the conclusion of that post, I’ll address those cons — showing how Sensu and Prometheus form a complementary solution.
 Photo by Erwan Hesry on Unsplash
Sensu + Prometheus
In part 2 I discuss Prometheus’ strengths, especially when it comes to monitoring Kubernetes, as well as where it falls short in terms of its data model. The good news is we’ve made it easy to use Sensu and Prometheus together, so you can get a complete picture for monitoring your entire infrastructure. Here are just a few advantages to using Sensu to power up your Prometheus monitoring:
- Service health checks + metrics. Prometheus is a great solution for collecting and processing telemetry data, but there’s more to monitoring than just metrics. Sensu’s comprehensive service health checking abilities (like the ability to monitor external resources with proxy requests and entities) helps fill gaps in a purely telemetry-focused approach.
- Workflow automation – take action! Problem detection is only the first step in an effective monitoring strategy. Once performance degradations or system failures are detected, we must take action – but those actions aren’t always just “alerts” (hopefully, for the sake of your operations teams, these aren’t just alerts!). Sensu’s monitoring event pipeline provides powerful and extensible solutions for automating workflows, including collecting additional context, automated remediation and CMDB registration on discovery of new nodes/endpoints, and many more. Alerts should be reserved for tasks that operators can’t automate — if you’re doing repetitive work in response to monitoring alerts, you might need to evaluate whether you have the right tools.
- Get more context by scraping Prometheus endpoints and further enriching the telemetry data with additional data from Sensu (i.e., all the information about the system your Sensu agent is running on). With more fields and more context, you’ll be able to compose more complex queries later.
- Flexibility — AKA, more ways to get data into Sensu. Sensu provides a single monitoring agent, allowing you to collect monitoring data in a variety of ways, as opposed to choosing a single method of collection. With Sensu, you get Prometheus endpoint scraping, service checks, and first-class APIs. Sensu fits perfectly within multiple monitoring instrumentation ecosystems — if you need to throw a ton of data at Sensu, go right ahead! Sensu lets you take advantage of the Prometheus instrumentation libraries while allowing you to process and store it in the database of your choosing, like InfluxDB, Elastic, or Splunk.
- A more secure transport — Sensu supports and uses standard cryptography for communication. Sensu’s model allows for a single agent to collect and transmit data securely over complex networks without having to compromise firewalls.
Essentially, Sensu enables you to monitor your entire infrastructure — from Kubernetes to bare metal. While Prometheus’ model is focused purely on telemetry data, Sensu offers visibility into your entire stack, working with industry standard technologies and formats (like Nagios and StatsD). Sensu complements Prometheus while giving you additional context from events, health checks (i.e., not just metrics), more comprehensive capabilities around processing monitoring data as a workflow (i.e., Sensu handlers can do a lot more than just alerts), and a secure solution.
Sensu + Kubernetes monitoring: how it works
- Sensu agents are most commonly deployed as Kubernetes sidecars (one agent per Kubernetes pod), or as a Kubernetes daemonset (one agent per kubelet/node).
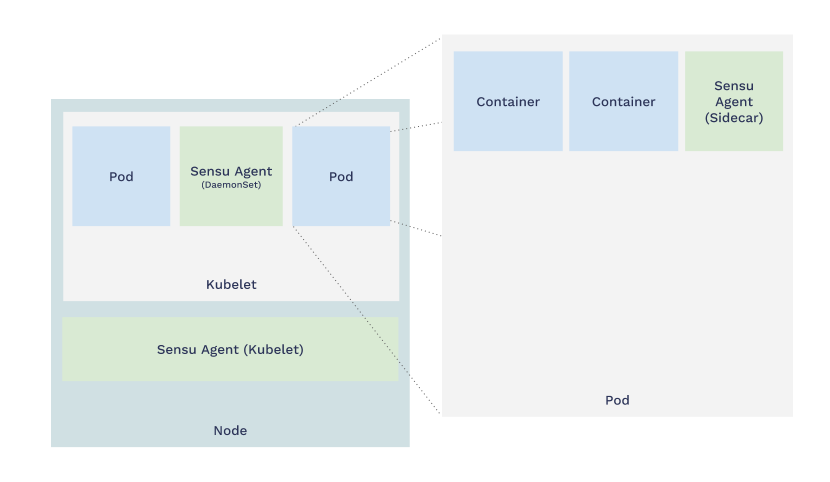 Sensu deployment strategies for Prometheus
- The Sensu agent performs service health checks (i.e., generating event data) and collects telemetry data from a variety of sources, including Prometheus endpoints. The Sensu agent then provides a secure pubsub transport, transmitting event and telemetry data to the Sensu backend – easily traversing complex network topologies without punching holes in firewalls.
- The Sensu backend provides a horizontally scalable monitoring data processing solution that extends well beyond just sending alerts. Sensu processes data via event handlers, which can route metrics to your preferred data store (e.g. InfluxDB, Elasticsearch, etc), trigger automated remediation actions, or create and resolve tickets in PagerDuty or ServiceNow.
Many of our customers are already doing this — see this talk from Workday’s David Beaurpere from last year’s Sensu Summit. The following diagram — adapted from David’s presentation — shows how Prometheus (and other monitoring data) flows through Sensu.
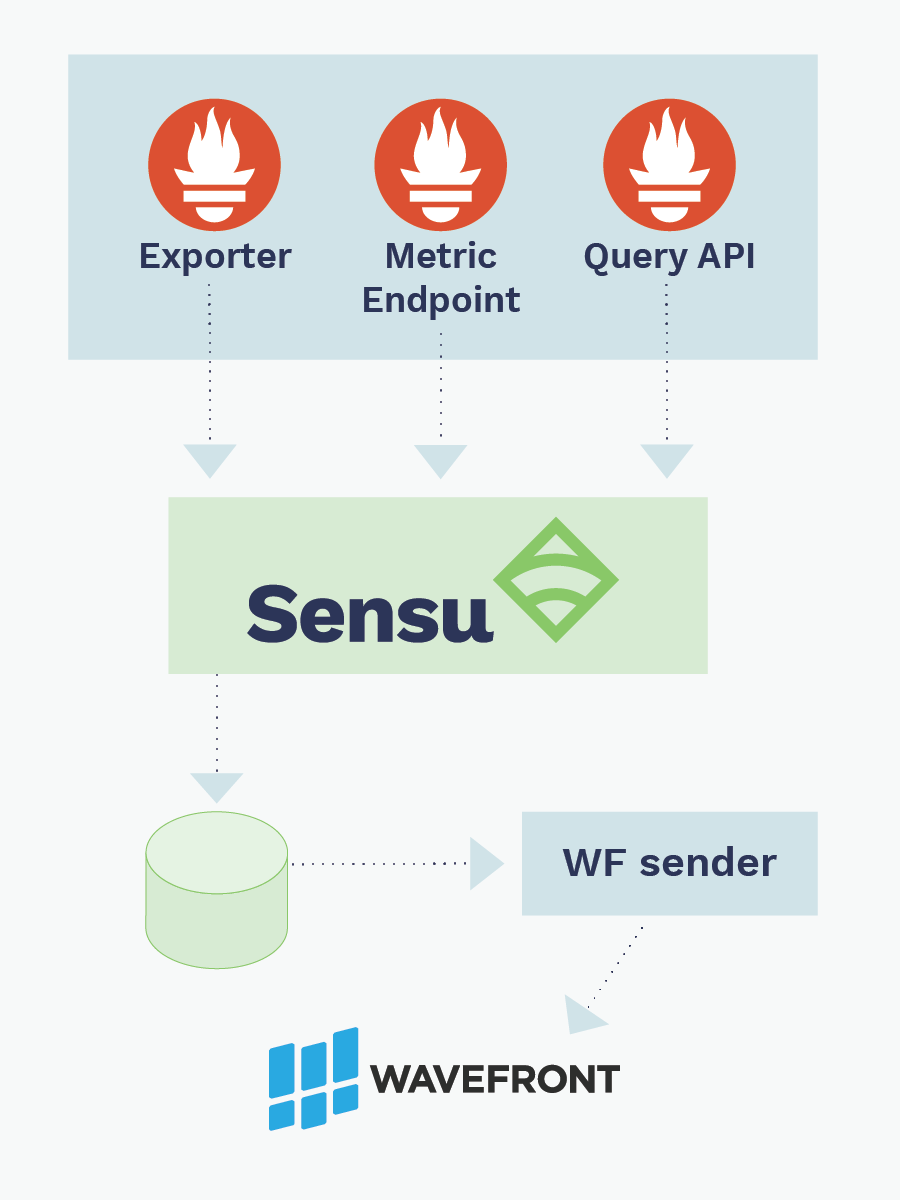 Workday’s Sensu + Prometheus monitoring workflow.
By now, you’ve likely come to realize the challenges — and opportunities! — Kubernetes presents, especially when it comes to monitoring. As outlined in part 2, Prometheus is definitely a starting point, but for complete visibility and flexibility you need a comprehensive monitoring solution such as Sensu, which complements Prometheus while enabling you to monitor your entire infrastructure. In my next post, I’ll cover monitoring Kubernetes with Sensu (sans Prometheus — the Sensu-native approach!), as well as how to monitor your applications running on Kubernetes.
Interested in learning more about Kubernetes monitoring? In the coming weeks we’ll be hosting a webinar with Sensu CEO Caleb Hailey, who will cover the various approaches and best practices, plus a demo of Sensu and Prometheus in action. Sign up to stay in the loop.

Made with #monitoringlove by SensuTM in Canada 🇨🇦 and the USA 🇺🇸. © 2017-2021 – Privacy Statement – Terms & Conditions