This post was adapted from an article Caleb wrote for The New Stack.
At Sensu, we define monitoring as “the action of observing and checking the behavior and outputs of a system and its components over time.” Essentially, you want to be made aware of a problem before your users are.
The collection of monitoring data is essentially a solved problem: there’s a plethora of tools (Datadog, Nagios, and Prometheus, just to name a few) that offer insight into how your systems and applications are performing. Where it gets interesting (and wherein lies the challenge), is connecting that data with the systems and tools you rely upon. And, modern infrastructures are increasing in velocity, and increased velocity further exacerbates the problem of connecting disparate data from the bounty of tools at our disposal. The life of an operator is all about becoming a proficient systems integrator. My favorite analogy for this is “trying to fit a square peg in a round hole” — i.e., getting data from modern systems like Kubernetes into legacy tools (e.g. Nagios) or getting data from legacy systems (e.g. SNMP traps, or metrics collected in outdated formats) into modern tools like InfluxDB.
I love this scene from Apollo 13 for how well it depicts our day-to-day life as operators. It has everything:
- A top-down mandate from “the people upstairs.”
- A time-sensitivity that only an operator would truly appreciate (though in the case of this scene, they are dealing with a potential life and death situation. Technical operations and actual life/death situations are not the same things — I want to be clear on that, and give credit and thanks to first responders and real-life NASA engineers for the work they do).
- A need to solve a problem introduced by decisions you had no influence over (the square peg), a requirement to solve the problem using some existing tool (the round hole).
- Limited resources that sometimes feel like a pile of incompatible parts strewn across a table.
As operators, we might not have had a say in the design of the service that is failing in production, but we do have the job of solving the problem and reporting on our progress in the tool that the rest of the organization uses to track work.
The solution to all of this is surprisingly simple: getting data from one tool or system to another is ultimately just a workflow. And when you begin to view these “square peg in a round hole” challenges as workflows that can be automated, the results are really impactful. At Sensu, we’re completely changing how we help customers reason about these challenges by enabling them to apply workflow automation principles to monitoring. We’ve been working towards making this possible for over seven years — by building the world’s first monitoring event pipeline.
Here’s a brief explainer:
Without further ado, here are the top five things to know about the Sensu monitoring event pipeline:
- As I stated earlier, monitoring has been all about trying to fit a square peg into a round hole. You have a multitude of tools for monitoring your infrastructure, but no way for them to speak to each other. First and foremost, Sensu enables you to streamline that process and automate your monitoring workflow.
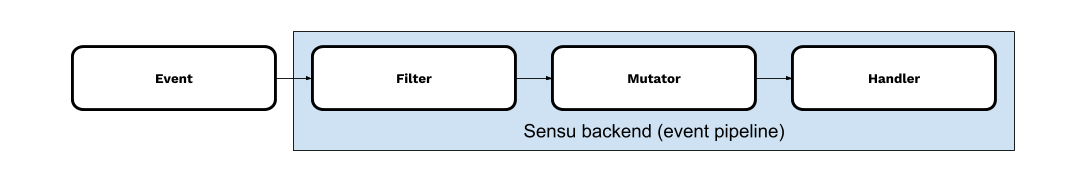
We consume monitoring events (e.g., availability and performance data) and provide a simple set of building blocks (or core “primitives”) including event filters, event payload mutators, event handlers, and more. These simple building blocks enable users to model workflows and automate them using Sensu.
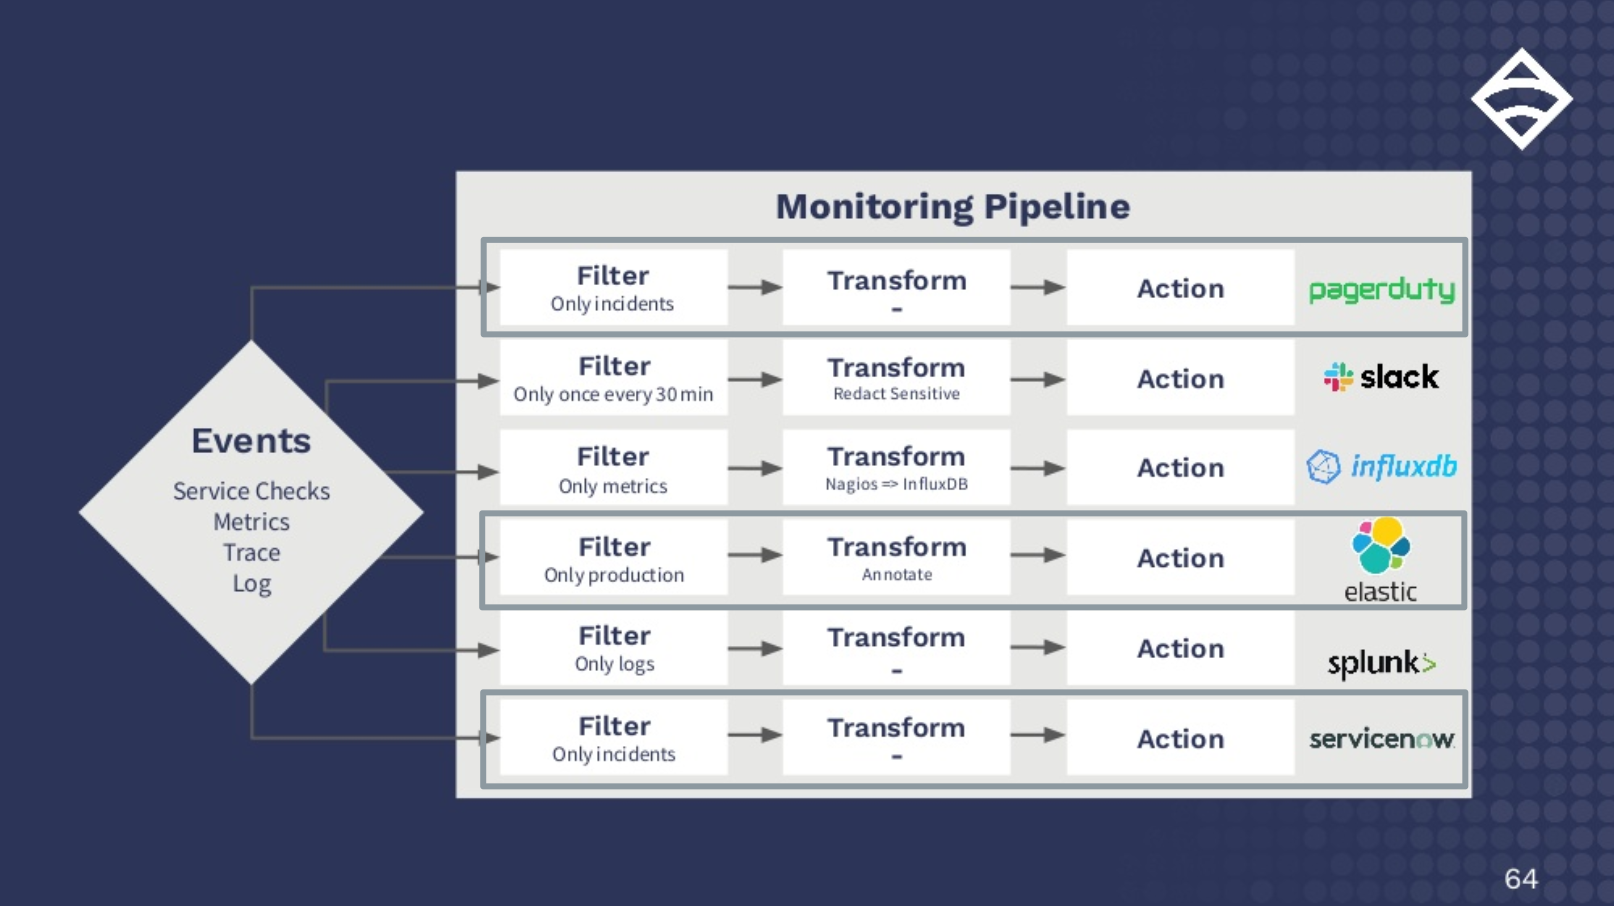
With this approach, you can consolidate data and integrate disparate or otherwise incompatible monitoring tools – connecting monitoring outputs (e.g. from modern and legacy systems), with existing operational tools (e.g. ITSM systems). Here are just a few very simple examples:
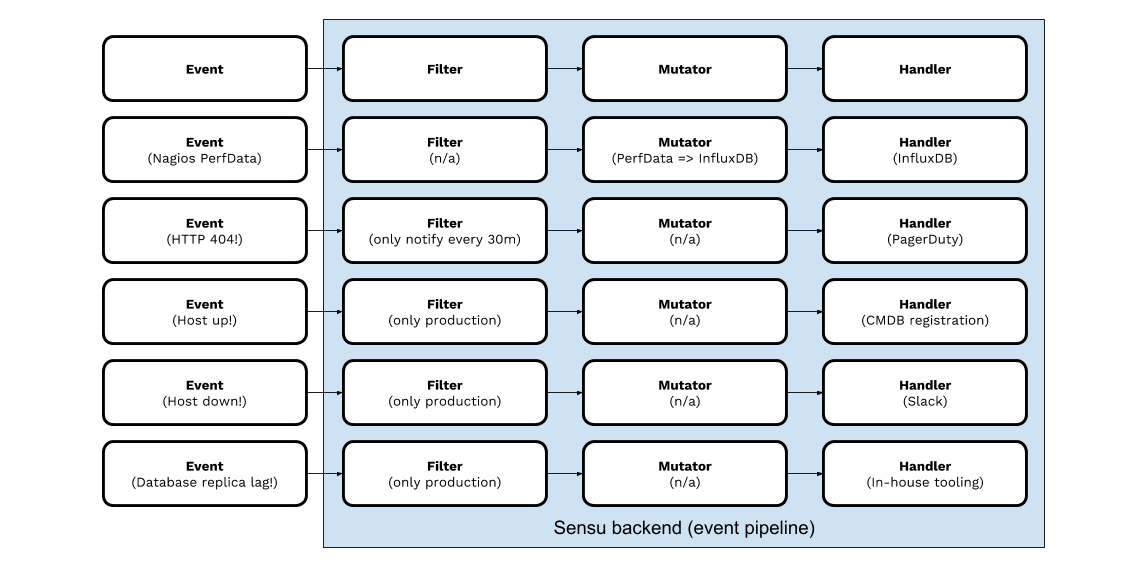
Think of every business requirement you have for monitoring: from a box on someone’s desk to Kubernetes pods or serviceless instances. With Sensu, you can distill these disparate technologies (and the tools for monitoring those technologies) down to a single workflow.
- The Sensu Agent makes Sensu broadly adaptable across multi-generational datacenters and hybrid cloud infrastructures, making monitoring your ephemeral infrastructure so easy it feels like cheating.
By using auto-discovery, Kubernetes and other container environments can be set up for monitoring the instant they’re spun up, and monitoring is set to turn off the instant they’re spun down. Just because a node is up for less than a minute doesn’t mean you shouldn’t be able to monitor it. Also, no one needs any more service alerts on infrastructure they intentionally spun down.

- One of our main goals at Sensu is to improve the life of operators. It’s time for alert fatigue and pager-associated PTSD to end. Applying filters to your monitoring ensures that dev servers crashing at 2am don’t wake you up and that minor faults can wait until you have had your morning cup(s) of coffee.

-
Are you finally ready to migrate from OpenTSB to InfluxDB, but you fear the migration headaches and plugin rewrites? It’s your data; use it where you need it. The mutators built into Sensu Enterprise make transitioning that data a snap, and you can easily visualize that data using Graphite or Grafana. (You can also easily write to both DBs, i.e., during a migration.)
-
The coolest part of the monitoring event pipeline is that it installs on your hardware, as opposed to being another run-of-the-mill SaaS product. This results in customization potential and security benefits (Look Ma, no firewall penetration!) that truly make it stand out as the best way to address your monitoring.

As you can see, hybrid cloud monitoring becomes a lot easier to reason about when everything is a “workflow.” It’s not only easier, but the possibilities for what you can monitor (and how) are virtually endless. We’re excited to continue learning from our customers and community on how they’re automating their monitoring workflows.
Ready to learn more about the monitoring event pipeline, including how to automate your monitoring workflow and specific use cases? Download our whitepaper.
Related Posts

Heightened visibility & deeper control with a monitoring control plane
The control plane is a centralized management interface. In this post, Caleb discusses the role of a control plane in monitoring — telling the story of how our users’ need for deep visibility into their applications, and control over their monitoring.
Observability Pipelines: Why you need one, and why you should stop rolling your own
Why you should be using Sensu’s observability pipeline — and why rolling your own solution from scratch is far too costly."> <meta name="generator

Monitoring and observability: how the two concepts feed each other to create a holistic approach to visibility
The whole debate around monitoring versus observability misses the point: the two are not mutually exclusive, but symbiotic. Sensu CTO Sean Porter discusses.

Made with #monitoringlove by SensuTM in Canada 🇨🇦 and the USA 🇺🇸. © 2017-2021 – Privacy Statement – Terms & Conditions