Monitorama is the event of the year if you’re in the monitoring and observability space! It’s an inclusive event for speakers, attendees, and vendors alike to network and learn from each other in a safe, comfortable, and accessible environment.
Did you know? On top of accommodating travel on a case-by-case basis, Monitorama pays their speakers to ensure that anyone can speak at the conference no matter their financial situation.
In its 6th annual Portland conference held at the Armory, organizers showcased an impressive 3-day lineup of single-track speakers. The content spanned different monitoring scopes such as metrics, distributed tracing, chaos engineering, governances/compliance, efficiency engineering, monitoring/observability tools, and more. Monitorama also fosters an attendee-focused environment, rather than a vendor-focused one. So while there were some short, sponsored talks sprinkled in, the sponsors do a great job to present relevant content without sounding too “pitchy.” To experience it all for yourself, past and present livestreams from the conference can be found on YouTube! For a more consolidated recap of some of my favorite talks and events, just keep reading on 😉
Chaos Engineering Traps
Chaos engineering is definitely not a bull in a china shop type of situation. Its intention is not to ensue chaos without careful consideration of the potential consequences and remediation on the systems which you wreck havoc. Since real chaos experiments happen in production, rather than sandboxes, it’s important to always approach chaos engineering in a deliberate and cautious way.
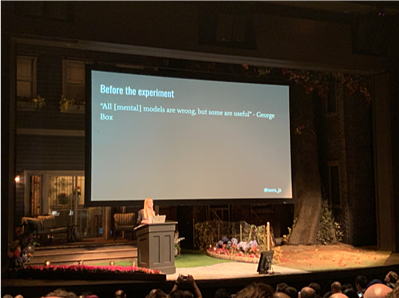
“Creating chaos is easy. Minimizing the blast radius, implementing safety, and understanding when things are not going well is difficult,” says Nora on the art of creating a chaos plan. Since there is no prescriptive formula for chaos experiments, it’s imperative that the engineers architecting and conducting the experiments have a really good understanding of the system, if not experts within the discipline. While creating chaos is easy, talking about the result of the experiment can be hard. That’s why Nora advises that there should always be an unbiased facilitator involved, and basically everyone else that might help fill the holes in the knowledge of the overall system/process (you’re actually wasting time by not involving them!).
Pattern recognition can actually be detected when going through the process of automating chaos experiments. Once these automated tests are conducted, vulnerabilities within the system are brought to the surface with as much contextual information as possible. Nora claims that requiring people to fix the vulnerabilities you find often harms relationships, so it’s usually best to let someone within that specialty address it.
In conclusion, the goal of chaos engineering isn’t to simply find vulnerabilities through tooling (Nora actually suggests that the number of vulnerabilities found is not a useful statistic). Rather, the goal of chaos engineering is to push forward on a journey of resilience through the vulnerabilities that are found.
Explain it Like I’m Five - What I Learned Teaching Observability to My Kids
Dave Cadwallader | @geek_dave | Video
As soon as Dave walked onstage alongside his son, I had pleasant flashbacks to the last time I saw him speak live at GrafanaCon. In that demo, his children were bouncing on a mini trampoline onstage, all while live-streaming the telemetry data from a Raspberry Pi into a Grafana dashboard. While that content was super relevant to the conference, he also shared some insights on what his kids learned about scientific experiments, and what he learned from teaching his kids complex technology concepts. His Monitorama talk had a very similar theme.
In this experiment, Dave used Prometheus on a Raspberry Pi to monitor sound waves around the garage door of their house. The idea was to use Prometheus alerting to detect when the garage door was open or closed (and hopefully mitigate wild bears from rummaging through the fridge in their garage). Node-RED, a visual programming tool for wiring hardware devices, can be instrumented for everyday appliances such as Phillips colored light bulbs. Dave walked his kids through the tool, and they programmed it such that the light bulb would turn red if the garage door had been open for more than 10 minutes.
This technology stack worked great under the original configuration for weeks, until one day when Dave and his wife came home to an open garage door while the red alert light remained off. Thankfully, his “on-call engineers” responded to the incident on time, and their post-incident report revealed that the alert did not go off due to environmental causes. In cold weather, sound travels much slower, so the original threshold for the sensor was too high to detect the garage was open under these conditions. Of course the family fixed the bug and lowered the threshold to account for changes in temperature, but that’s not the extent of what they learned together.
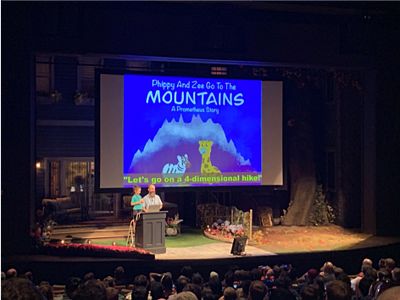
Dave suggests that you should explain things at a basic level without assuming prior knowledge, which helps with overall understanding. To drive this point home, his daughter recited a story called “Phippy and Zee go to the Mountains: A Prometheus Story,” which essentially explains how all the different Prometheus components work, at a very basic level.
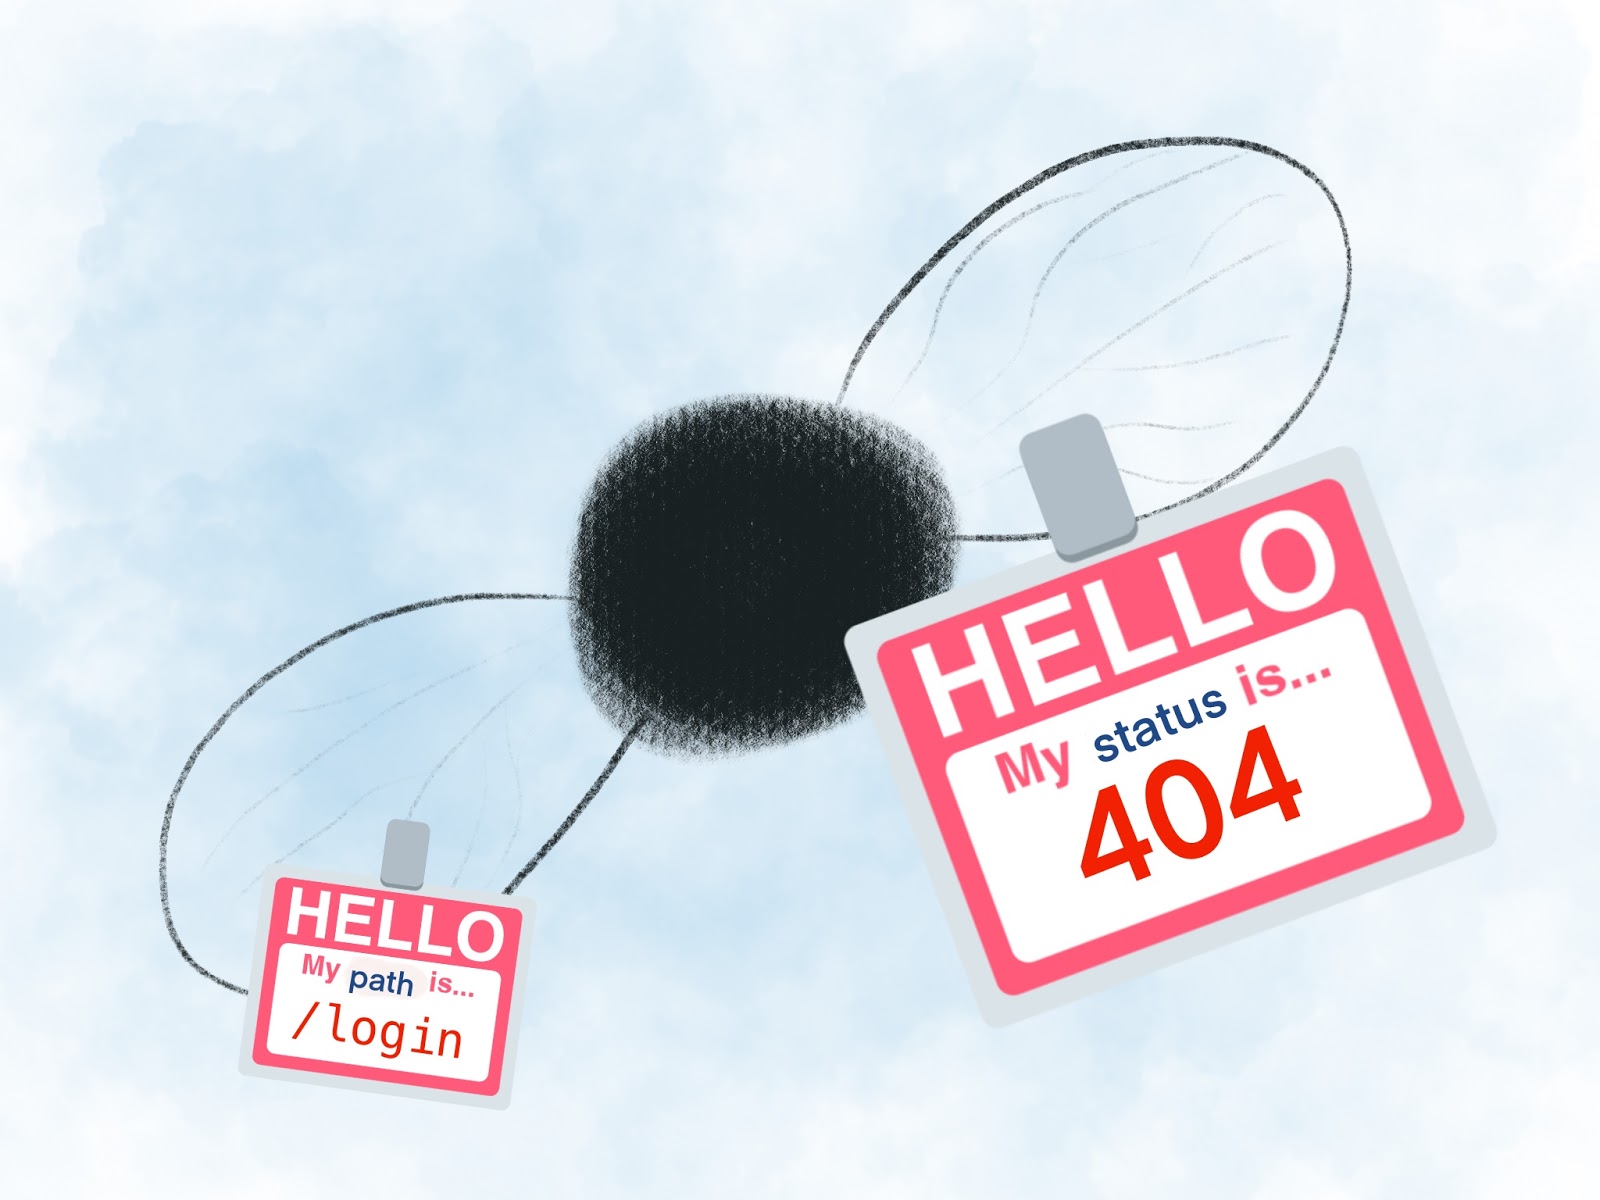 Zee noticed one fly with a tag reading “status: 404.” “That one looks lost,” Zee said. “I hope she finds her way home.”
Dave understands that work/life balance is hard, and while we don’t always want to bring work home with us, there is an excellent opportunity to bring tools home from work, and implementing them outside of work will help with your creative understanding. He advocates that we should all find the “feather for your bear trap” and bridge the gap between people and what you do, because it will take you down rabbit holes and targets of learning that you weren’t even expecting.
Logs, Metrics, and the Evolution of Observability at Coinbase
Luke Demi | @luke_demi_ | Video
Luke’s talk on logs and metrics was one of my favorites. So much so, that I was more focused on enjoying his brutally honest and hilariously opinionated presentation rather than taking notes. I link his talk above, but I highly recommend watching the full talk if you can.
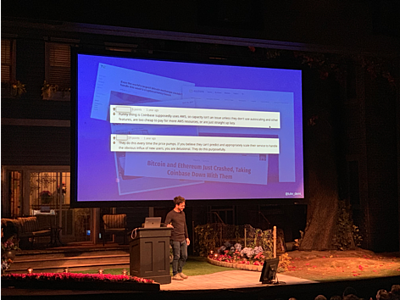
Coinbase, a popular cryptocurrency platform, experienced an outage for several days. The outage produced large amounts of arbitrary logs which were ultimately unhelpful to debugging the issue. Luke claims that’s because Coinbase’s original philosophy was defined by the acronym LEARN:
Log
Everything
Arbitrarily, but
Rely on
New Relic, primarily
During their search for better monitoring and observability tools, they sought high (and somewhat unachievable) goals, but understood the tradeoffs associated with certain decisions. Luke knew they needed structured logs since unstructured logs can’t deliver real insight, so they evaluated tools such as Kibana and Elasticsearch. They found that Kibana had low latency, low granularity, and high cardinality, while Elasticsearch was a great log search engine, but not a great user-facing backend.
For metrics, Coinbase landed on Datadog, because it’s “intuitive with fast aggregations.” However, due to the SaaS nature of the product, they had to perform some workarounds to secure their cryptocurrency platform. Honeycomb also made the list on their journey searching for a well-rounded monitoring solution. Using multiple, disconnected solutions however, can often lead to isolated environments.
“Metrics, events, logging, tracing… What is the one perfect solution?” Luke asked the crowd, “Well, how much money do you have?”
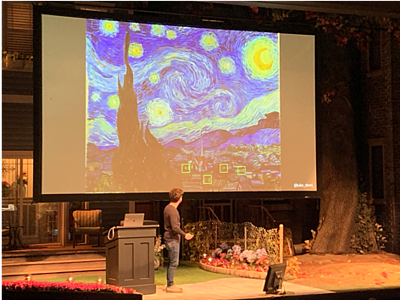
Luke concluded his talk with a critique on metrics, and mentioned how often humans can misinterpret them. “Metrics don’t give you context,” he explained with a zoomed in, pixelated version of Vincent van Gogh’s famous Starry Night. “You need context to investigate the real world.”
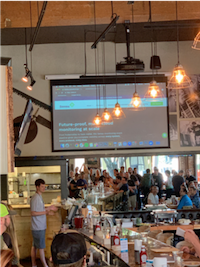
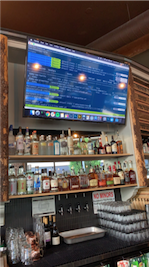
Sensu after-party and live demo at Backwoods Brewing Co.
Sean Porter | @portertech
Maybe I’m biased, but I thoroughly enjoyed the Tuesday night outing at Backwoods Brewing Co. Sensu CTO Sean Porter presented a revamped edition of his 2018 demo stack with Sensu Go 5.9.0! A packed room of beer and whiskey drinkers intently watched as he deployed Sensu on Kubernetes, showcasing Sensu’s multi-tenancy, monitoring checks, and event pipeline. He finished the demo displaying a Grafana dashboard of Prometheus telemetry data routed by Sensu.
Ready for another amazing conference with a focus on monitoring and observability (not to mention talks from Sean and yours truly)? Join us at Sensu Summit, September 9-10 in Portland: https://summit.sensu.io.
Related Posts
Back to school at Sensu Summit 2019
On September 9-10, 2019, the community came together for Sensu Summit for talks, workshops, and a touch of high school nostalgia. Read on for our recap.
Demonware’s journey to assisted remediation
In this post, Sensu VP of Customer Reliability Cameron Johnston highlights the key decisions that helped Demonware reduce daily alerts, fix underlying problems, & establish a more engaged Monitoring Team

Chaos engineering + monitoring, part 2: for starters
When you consider what happens with an incident, the last thing anyone wants is more monitoring noise, or to be surprised by the information they receive.

Made with #monitoringlove by SensuTM in Canada 🇨🇦 and the USA 🇺🇸. © 2017-2021 – Privacy Statement – Terms & Conditions