This is a guest post to the Sensu Blog by Andy Repton, member to the Sensu community. He offered to share his experience as a user in his own words, which you can do too by emailing community@sensu.io.
Schuberg Philis, a Dutch Managed Services provider based in Amsterdam, is a company dedicated to 100% customer satisfaction; we distinguish ourselves by running the Mission Critical Workloads of our customers. When Kubernetes sprung onto the scene we were excited by the possibilities that it represented and were eager to start using it in our engineering teams. As of today we run over 20 Kubernetes clusters in production for a variety of teams across multiple private and public clouds.

As part of being production ready we require detailed functional monitoring, and since we started deploying Kubernetes we’ve used Sensu as the monitoring solution for it all. This has supported our growing demand from both our internal teams and external customers, while also helping us meet our 100% uptime guarantee. This journey we took creating and updating our monitoring for a container landscape, while also migrating our existing infrastructure from Nagios to Sensu, presented us with some interesting challenges and opportunities.
We believe as a company that one of the secrets to uptime is not standing still but rather continuously evolving to avoid fragility. This aligns well with our customer’s expectations which have recently started the significant shift towards container technologies. As we expanded into containerised workloads we needed a powerful, scalable monitoring solution that would not only support this new world but our existing Virtual and Physical infrastructure as well. The solution we chose was Sensu.
Why we built it (where we started)
Nearly two years ago my colleague, Michael Russell, and myself started building what would become our Mission Critical Kubernetes platform. We took stock Kubernetes and added high availability, secure best practises, and monitoring to allow our individual customer teams at Schuberg Philis to easily start using this new technology.
We take monitoring very seriously because of our uptime requirements. Our existing infrastructure used Nagios as a monitoring solution but we had started to hit the limits of what it was capable of handling. On average our monitoring solution processes around 65,000 events per day, and at over 5,000 individual checks, all pull-based from our central servers, the system was starting to strain under the load. In addition, as we started looking into more dynamic infrastructure (where our systems may only exist for days or even hours before being replaced) the amount of time required to regenerate and manage the configuration became challenging.
While deciding on our solution we knew there was a huge benefit to ensuring our replacement tool had familiar semantics to what we were used to. We decided not to opt for a telemetry-only alerting system (like Prometheus) because it would mean a costly rewrite of all of our existing checks, and we would have to retrain the 250 engineers we have writing checks. Sensu provided the bridge. We can reuse the same monitoring logic of Nagios and can run existing Nagios checks we have in NRPE without a rewrite while solving the scaling issues we were facing with a scalable transport layer.
Rolling out exciting new infrastructure gave us an opportunity to reevaluate our monitoring framework. We decided on Sensu as the right choice.
What we built
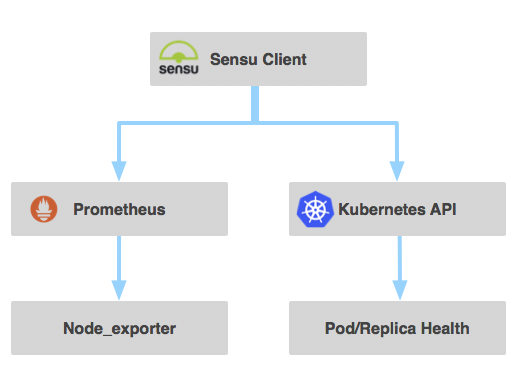
We run over 20 production Kubernetes clusters deployed across private and public clouds supporting dozens of teams internally and externally all monitored by Sensu. Within our clusters the flow is similar to this:
Our deployment of our clusters is slightly unique. From the base we use a combination of Terraform and Ansible to deploy an initial Kubernetes cluster that we call the Management Kubernetes Cluster. This cluster is where we deploy the master components of our other Kubernetes clusters: the Apiserver, Controller Manager, and the Scheduler. When we started with Kubernetes, the lifecycle management of the master components was a major challenge and a challenge that Kubernetes itself excels at solving. By having our master components in a separate cluster, problems such as secret management, rolling upgrades, and high availability became remarkably simple. Since we started with this we’ve noticed that this is becoming a more common practice (see this article from The New Stack) and it’s working remarkably well for us.
Once our clusters were deployed we moved our focus to monitoring.
Iteration One: The existing kubernetes plugin
https://github.com/sensu-plugins/sensu-plugins-kubernetes
With this first iteration, we needed to check apiserver health, etcd health, etc. This monitoring was focused on the cluster itself and was a great starting point for us. With our master components now fully monitored for availability we moved our focus to the nodes.
Iteration Two: Adding Prometheus and node checks
While some work in the Sensu community had produced a set of plugins, we noted the excitement and momentum invested into the Prometheus project for scraping Kubernetes metrics (https://github.com/prometheus/prometheus). We felt that leveraging this to scrape metrics inside our clusters was a sensible move. The challenge here was that there were no plugins for Sensu to scrape Prometheus, so we wrote one ourselves and open sourced it:
https://github.com/schubergphilis/sensu-plugins-prometheus-checks
Using this, combined with the node_exporter, we were now monitoring the nodes and the health of our kubelets. Additionally, we started to scrape the Kubernetes API to add node metrics coming to the API from the metrics endpoints.
We centralised the checks in this way so that we could adjust the configuration as it evolved without needing to change anything on the nodes. This way we wouldn’t need to re-run configuration management tooling if we deployed a new monitoring alert.
The current production setup we run on our clusters runs a node exporter as a daemon set, a Prometheus deployment that scrapes this, and a Sensu client deployment that gathers all of this information and sends it on to our central Sensu server using an encrypted connection.
Iteration Three: Adding our check-k8s functional checks
More requirements arose as we improved upon the project. It was not sufficient to merely care about the health of the cluster, we also had to care about the health of the systems running within it. For example, we needed to make sure our pods were healthy and our replica sets were not clustering our pods together. This encouraged us to start writing another plugin: check-k8s.
We dynamically set Kubernetes limits and requests so we don’t overload our nodes, but for some of our clusters the focus is on the average CPU and Memory of the entire cluster rather than individual nodes. We adjusted the plugin to give us the average load over all CPUs in the cluster so we know when we need to scale up or down the nodes:
        def load_per_cpu(_)Otávio Fernandes, 4 years ago: • Adding libraries.
          cpu_per_source = {}
          @client.query(
            '(count(node_cpu{mode="system"})by(instance))'
          ).each do |result|
            source = result['metric']['instance']
            cpu_per_source[source] = result['value'][1]
          end

          metrics = []
          @client.query('node_load5').each do |result|
            source = result['metric']['instance']
            value = result['value'][1].to_f.round(2)
            load_on_cpu = value / cpu_per_source[source].to_f
            log.debug(
              "[load_per_cpu] value: '#{load_on_cpu}', source: '#{source}'"
            )
            metrics << {
              'source' => source,
              'value' => load_on_cpu,Michael Russell, 4 years ago: • Fully restore backwards compatability and add…
              'name' => 'load'
            }Otávio Fernandes, 4 years ago: • Adding libraries.
          end
          metrics
        end
This infrastructure and the resulting plugins have allowed us to rapidly iterate our infrastructure. Below I’ll go into some of the challenges and solutions that we encountered during our journey of implementing Sensu for our Kubernetes setup.
Our challenges and solutions during our journey
As we iterated our monitoring deployments we learned a lot. Here are some of our experiences from implementation:
The migration path
What was the best way to migrate from Nagios to Sensu? Our existing monitoring needed to continue working without interrupt. As we already used NRPE as a standard we added the Sensu client to each virtual machine and reused the existing checks without further adjustment.
Alert routing from inside a shared Kubernetes cluster
We have so many events being processed across our teams that our setup splits the alerts into different teams based on the hostname of the server; with multiple teams potentially sharing a Kubernetes cluster we needed to keep this functionality.
With our Kubernetes setup we can have several teams running dedicated setups in the same cluster. Our administration team is ensuring DNS, the Dashboard, and the Sensu client are all running in the kube-system namespace, a development team could have a microservices architecture in the production namespace, and a security team might have an automated cronjob running in the security namespace. These all needed to be monitored with alerts going to their respective teams and it seemed wasteful to run multiple Sensu clients for this.
Luckily Sensu allows us to spoof any hostname we like, so we built this functionality in, setting a different hostname per namespace:
$ kubectl create namespace sensu-article
$ kubectl label namespace sensu-article pagethis="true"
$ kubectl label namespace sensu-article monitoring_prefix="mcpasensu"
$ kubectl -n sensu-article run nginx --image=nginx:latest --replicas=1
Using these commands…
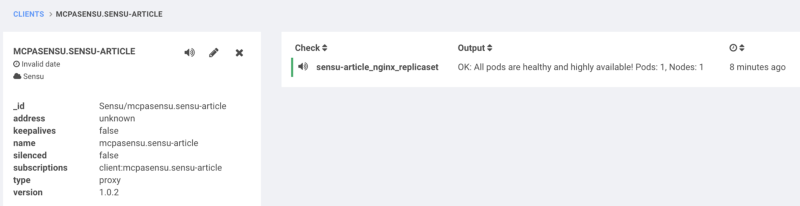 …results in this in Sensu
How to keep multiple replicas separated
While Kubernetes is great at keeping a set number of replicas running at all times and recovering from node failure, often with our smaller clusters we found that all of our replicas would end up running on the same node. This was understandably frustrating as if the node crashed this would result in having all of our replicas die together.
While today, Pod Anti-Affinity is the best practise, in the early days this was was not available to ensure pods stay away from each other on nodes. To compensate, our check-k8s script alerts us if for any reason all the replicas are on the same node:
  def pods_highly_available(pod_data)
    total_pod_count = pod_data['pods'].count

    if @nodes >= 2 and total_pod_count > 1
      expected_nodes = 2
    else
      expected_nodes = 1
    end

    healthy_pods = pod_data['pods'].select { |pod| pod['status'] == 0 }

    healthy_nodes = []
    healthy_pods.uniq { |pod| pod['node'] }.each do |pod|
      node = @node_data.select { |node| node['metadata']['name'] == pod['node'] }.first
      healthy_nodes << pod['node'] if node['status']['conditions'].find { |x| x['type'] == 'Ready' && x['status'] == 'True' }
    end

    node_count = healthy_nodes.count

    if not node_count >= expected_nodes
      ha_check = {
        "output" => "Pods are not highly available! Nodes: #{node_count}/#{@nodes}",
        "status" => 2
      }
    else
      ha_check = {
        "output" => "Pods are running highly available. Nodes: #{node_count}/#{@nodes}",
        "status" => 0
      }
    end
Avoiding non-ready Pods
One day we had one of our development teams ask for some help in debugging an application that was running while the service endpoint was not responding. After some poking we realised that all of the pods were running but were not ‘ready’. They were stuck waiting for a third party service to start up. By checking if enough of our pods are ready we can then alert if a subset are stuck.
Combining these two checks allowed us a novel way to create an alert by creating a deployment with a single replica and using the readiness probe to create an alert. When the pod goes non-ready, we’ll receive a page:
apiVersion: extensions/v1beta1
kind: Deployment
metadata:
  name: sbphealth
  namespace: production
  labels:
    run: sbphealth
spec:
  replicas: 1
  selector:
    matchLabels:
      run: sbphealth
  template:
    metadata:
      labels:
        run: sbphealth
    spec:
      containers:
      - command:
        - tail
        - -f
        - /dev/null
        image: appropriate/curl
        imagePullPolicy: Always
        name: sbphealth
        readinessProbe:
          exec:
            command:
            - /usr/bin/curl
            - https://schubergphilis.com/alive.txt
          failureThreshold: 5
          initialDelaySeconds: 5
          periodSeconds: 10
          successThreshold: 1
          timeoutSeconds: 10
This example uses cURL but as you can run any image you like any level of complexity could be baked into the container and used as an alerter. Clearing the alert is as simple as removing the deployment and cleaning the agent from Sensu.
Selectively alerting namespaces
We found a common practice of a namespace per DTAP environment emerge, so decided to build into our plugin the ability to label a namespace to determine if it should be paging or not. With the label set to false the plugin will ‘fake’ an OK to the Sensu server.
It has never been easier for a developer on the team to turn off alerting on their pod for any reason. All our alerts, which are available here, look for a “pagethis=true” label. If it’s changed to false the Sensu check will always return 0. No need to edit check config files or rerun Chef — it’s as easy as an API or kubectl command.
Keeping Sensu config configurable
Alerts must be simple to configure and easy to turn on and off. Where was the right place to do that? In the Sensu config, Kubernetes labels, or elsewhere?
We wanted it to be incredibly simple to add and edit our checks so we designed two different ways to achieve this. The first using a Kubernetes config map for the Sensu client config and the second using our check-k8s plugin described above to create ‘Readiness Probe’ checks.
A large challenge was identifying the right metrics to check. Some of our teams didn’t care about CPU usage or Memory alerts. Their systems were designed to autoscale when resource usage was high. To make the solution flexible we use a Kubernetes config map to allow each team to determine the checks they would like enabled.
---
apiVersion: v1
kind: ConfigMap
metadata:
  name: check-prom-config
  namespace: monitoring
data:
  prom.yml: |
    ---
    config:
      reported_by: ${CLUSTERNAME}
      occurrences: 3
      whitelist: ${CLUSTERNAME}
    checks:
      - check: service
        cfg:
          name: kube-kubelet.service
      - check: service
        cfg:
          name: kube-proxy.service
      - check: service
        cfg:
          name: docker.service
      - check: memory
        cfg:
          warn: 90
          crit: 95
      - check: load_per_cpu
        cfg:
          warn: 4.0
          crit: 8.0
      - check: disk_all
        cfg:
          ignore_fs: 'tmpfs|overlay|nsfs|autofs'
          warn: 90
          crit: 95
    custom:
      - name: heartbeat
        query: up
        check:
          type: equals
          value: 1
        msg:
          0: 'OK: Endpoint is alive and kicking'
          2: 'CRIT: Endpoints not reachable!'
---
apiVersion: v1
kind: ConfigMap
metadata:
  name: sensu-config
  namespace: monitoring
data:
  client-checks.json: |
    {
       "checks" : {
          "check_kube_api_service" : {
             "interval" : 30,
             "standalone" : true,
             "occurrences": 3,
             "command" : "/usr/local/bundle/bin/check-kube-apiserver-available.rb --in-cluster"
          },
          "check_prometheus_alerts" : {
             "command" : "/usr/local/bundle/bin/check_prometheus.rb /etc/sensu/prom/prom.yml",
             "interval" : 60,
             "occurrences": 3,
             "standalone" : true
          },
          "check_k8s" : {
             "command" : "/usr/local/bundle/bin/check-k8s.rb pagethis=true ${CLUSTERNAME} $HOSTNAME",
             "interval" : 60,
             "occurrences": 3,
             "standalone" : true
          }
       }
    }
Use our code
To deploy our setup inside your own Kubernetes cluster you’ll need the following code to set up the targets. Note: we deploy into a ‘monitoring’ namespace.
The namespace:
---
apiVersion: v1
kind: Namespace
metadata:
  name: monitoring
  labels:
    pagethis: "true"
The Prometheus configmap:
apiVersion: v1
data:
  prometheus.yml: |
    scrape_configs:
    - job_name: 'kubernetes-apiservers'

      kubernetes_sd_configs:
      - role: endpoints

      scheme: https

      tls_config:
        ca_file: /var/run/secrets/kubernetes.io/serviceaccount/ca.crt
        insecure_skip_verify: true
      bearer_token_file: /var/run/secrets/kubernetes.io/serviceaccount/token

      relabel_configs:
      - source_labels: [__meta_kubernetes_namespace, __meta_kubernetes_service_name, __meta_kubernetes_endpoint_port_name]
        action: keep
        regex: default;kubernetes;https
      - target_label: __address__
        replacement: kubernetes.default.svc:443

    - job_name: 'kubernetes-nodes'

      scheme: https

      tls_config:
        ca_file: /var/run/secrets/kubernetes.io/serviceaccount/ca.crt
      bearer_token_file: /var/run/secrets/kubernetes.io/serviceaccount/token

      kubernetes_sd_configs:
      - role: node

      relabel_configs:
      - action: labelmap
        regex: __meta_kubernetes_node_label_(.+)
      - target_label: __address__
        replacement: kubernetes.default.svc:443
      - source_labels: [__meta_kubernetes_node_name]
        regex: (.+)
        target_label: __metrics_path__
        replacement: /api/v1/nodes/${1}/proxy/metrics

    - job_name: 'node_exporters'

      bearer_token_file: /var/run/secrets/kubernetes.io/serviceaccount/token

      kubernetes_sd_configs:
      - role: node

      relabel_configs:
        - source_labels: [__address__]
          regex: '(.*):10250'
          replacement: '${1}:9100'
          target_label: __address__

    - job_name: 'kubernetes-cadvisor'

      scheme: https

      tls_config:
        ca_file: /var/run/secrets/kubernetes.io/serviceaccount/ca.crt
      bearer_token_file: /var/run/secrets/kubernetes.io/serviceaccount/token

      kubernetes_sd_configs:
      - role: node

      relabel_configs:
      - action: labelmap
        regex: __meta_kubernetes_node_label_(.+)
      - target_label: __address__
        replacement: kubernetes.default.svc:443
      - source_labels: [__meta_kubernetes_node_name]
        regex: (.+)
        target_label: __metrics_path__
        replacement: /api/v1/nodes/${1}/proxy/metrics/cadvisor

    - job_name: 'kubernetes-service-endpoints'

      kubernetes_sd_configs:
      - role: endpoints

      relabel_configs:
      - source_labels: [__meta_kubernetes_service_annotation_prometheus_io_scrape]
        action: keep
        regex: true
      - source_labels: [__meta_kubernetes_service_annotation_prometheus_io_scheme]
        action: replace
        target_label: __scheme__
        regex: (https?)
      - source_labels: [__meta_kubernetes_service_annotation_prometheus_io_path]
        action: replace
        target_label: __metrics_path__
        regex: (.+)
      - source_labels: [__address__, __meta_kubernetes_service_annotation_prometheus_io_port]
        action: replace
        target_label: __address__
        regex: ([^:]+)(?::\d+)?;(\d+)
        replacement: $1:$2
      - action: labelmap
        regex: __meta_kubernetes_service_label_(.+)
      - source_labels: [__meta_kubernetes_namespace]
        action: replace
        target_label: kubernetes_namespace
      - source_labels: [__meta_kubernetes_service_name]
        action: replace
        target_label: kubernetes_name

    # Example scrape config for pods
    #
    # The relabeling allows the actual pod scrape endpoint to be configured via the
    # following annotations:
    #
    # * `prometheus.io/scrape`: Only scrape pods that have a value of `true`
    # * `prometheus.io/path`: If the metrics path is not `/metrics` override this.
    # * `prometheus.io/port`: Scrape the pod on the indicated port instead of the
    # pod's declared ports (default is a port-free target if none are declared).
    - job_name: 'kubernetes-pods'

      kubernetes_sd_configs:
      - role: pod

      relabel_configs:
      - source_labels: [__meta_kubernetes_pod_annotation_prometheus_io_scrape]
        action: keep
        regex: true
      - source_labels: [__meta_kubernetes_pod_annotation_prometheus_io_path]
        action: replace
        target_label: __metrics_path__
        regex: (.+)
      - source_labels: [__address__, __meta_kubernetes_pod_annotation_prometheus_io_port]
        action: replace
        regex: ([^:]+)(?::\d+)?;(\d+)
        replacement: $1:$2
        target_label: __address__
      - action: labelmap
        regex: __meta_kubernetes_pod_label_(.+)
      - source_labels: [__meta_kubernetes_namespace]
        action: replace
        target_label: kubernetes_namespace
      - source_labels: [__meta_kubernetes_pod_name]
        action: replace
        target_label: kubernetes_pod_name
kind: ConfigMap
metadata:
  name: prometheus
  namespace: monitoring
The node_exporter daemon set:
apiVersion: extensions/v1beta1
kind: DaemonSet
metadata:
  name: node-exporter
  namespace: monitoring
spec:
  template:
    metadata:
      labels:
        app: node-exporter
      name: node-exporter
    spec:
      hostNetwork: true
      hostPID: true
      containers:
      - image:  quay.io/prometheus/node-exporter:v0.14.0
        args:
        - "-collector.procfs=/host/proc"
        - "-collector.sysfs=/host/sys"
        - "-collectors.enabled"
        - "conntrack,diskstats,entropy,filefd,filesystem,loadavg,mdadm,meminfo,netdev,netstat,sockstat,stat,textfile,time,uname,vmstat,systemd"
        name: node-exporter
        ports:
        - containerPort: 9100
          hostPort: 9100
          name: scrape
        resources:
          requests:
            memory: 30Mi
            cpu: 100m
          limits:
            memory: 50Mi
            cpu: 200m
        volumeMounts:
        - name: proc
          readOnly:  true
          mountPath: /host/proc
        - name: sys
          readOnly: true
          mountPath: /host/sys
      tolerations:
        - effect: NoSchedule
          operator: Exists
      volumes:
      - name: proc
        hostPath:
          path: /proc
      - name: sys
        hostPath:
          path: /sys
The Prometheus deployment and service:
apiVersion: extensions/v1beta1
kind: Deployment
metadata:
  generation: 1
  labels:
    name: prometheus-deployment
  name: prometheus
spec:
  replicas: 1
  selector:
    matchLabels:
      app: prometheus
  strategy:
    rollingUpdate:
      maxSurge: 1
      maxUnavailable: 1
    type: RollingUpdate
  template:
    metadata:
      creationTimestamp: null
      labels:
        app: prometheus
    spec:
      containers:
      - args:
        - -config.file=/etc/prometheus/prometheus.yml
        - -storage.local.path=/prometheus
        - -storage.local.retention=24h
        - -storage.local.target-heap-size=157286400
        command:
        - /bin/prometheus
        image: prom/prometheus:v1.8.2
        imagePullPolicy: IfNotPresent
        livenessProbe:
          exec:
            command:
            - /bin/timeout
            - -t
            - "5"
            - wget
            - -q
            - http://localhost:9090/status
            - -O
            - /dev/null
          failureThreshold: 5
          initialDelaySeconds: 15
          periodSeconds: 10
          successThreshold: 1
          timeoutSeconds: 10
        name: prometheus
        ports:
        - containerPort: 9090
          protocol: TCP
        resources:
          limits:
            cpu: 500m
            memory: 200Mi
          requests:
            cpu: 100m
            memory: 100Mi
        volumeMounts:
        - mountPath: /prometheus
          name: data
        - mountPath: /etc/prometheus
          name: config-volume
      dnsPolicy: ClusterFirst
      restartPolicy: Always
      schedulerName: default-scheduler
      securityContext: {}
      terminationGracePeriodSeconds: 30
      volumes:
      - emptyDir:
          sizeLimit: "0"
        name: data
      - configMap:
          name: prometheus
        name: config-volume
And then for Sensu, the Sensu client config map for the Prometheus check and the client-checks.json (replace CLUSTERNAME with the host you would like it to appear as in Sensu):
---
apiVersion: v1
kind: ConfigMap
metadata:
  name: check-prom-config
  namespace: monitoring
data:
  prom.yml: |
    ---
    config:
      reported_by: ${CLUSTERNAME}
      occurrences: 3
      whitelist: ${CLUSTERNAME}
    checks:
      - check: service
        cfg:
          name: kube-kubelet.service
      - check: service
        cfg:
          name: kube-proxy.service
      - check: service
        cfg:
          name: docker.service
      - check: memory
        cfg:
          warn: 90
          crit: 95
      - check: load_per_cpu
        cfg:
          warn: 4.0
          crit: 8.0
      - check: disk_all
        cfg:
          ignore_fs: 'tmpfs|overlay|nsfs|autofs'
          warn: 90
          crit: 95
    custom:
      - name: heartbeat
        query: up
        check:
          type: equals
          value: 1
        msg:
          0: 'OK: Endpoint is alive and kicking'
          2: 'CRIT: Endpoints not reachable!'
---
apiVersion: v1
kind: ConfigMap
metadata:
  name: sensu-config
  namespace: monitoring
data:
  client-checks.json: |
    {
       "checks" : {
          "check_kube_api_service" : {
             "interval" : 30,
             "standalone" : true,
             "occurrences": 3,
             "command" : "/usr/local/bundle/bin/check-kube-apiserver-available.rb --in-cluster"
          },
          "check_prometheus_alerts" : {
             "command" : "/usr/local/bundle/bin/check_prometheus.rb /etc/sensu/prom/prom.yml",
             "interval" : 60,
             "occurrences": 3,
             "standalone" : true
          },
          "check_k8s" : {
             "command" : "/usr/local/bundle/bin/check-k8s.rb pagethis=true ${CLUSTERNAME} $HOSTNAME",
             "interval" : 60,
             "occurrences": 3,
             "standalone" : true
          }
       }
    }
Generate your secrets for your certs and config (fill in your specific details):
{
  "rabbitmq": {
    "host": "${RABBITMQ_HOST}",
    "port": ${RABBITMQ_PORT},
    "user": "sensu",
    "password": "${RABBITMQ_PASSWORD}",
    "vhost": "/sensu",
    "ssl": {
      "cert_chain_file": "/etc/sensu/ssl/cert.pem",
      "private_key_file": "/etc/sensu/ssl/key.pem"
    }
  }
}
$ kubectl --namespace=monitoring create secret generic sensu-conf --from-file=connection.json=connection.json
Get your Sensu RabbitMQ cert and key:
$ kubectl --namespace=monitoring create secret generic sensu-certs --from-file=cert.pem=rabbitmq_cert.pem --from-file=key.pem=rabbitmq_key.pem
And deploy Sensu:
---
apiVersion: extensions/v1beta1
kind: Deployment
metadata:
  name: sensuclient
  namespace: monitoring
spec:
  replicas: 1
  template:
    metadata:
      labels:
        app: sensuclient
    spec:
      containers:
      - name: sensuclient
        image: missioncriticalkubernetes/sensu-client:3.3.2
        livenessProbe:
          exec:
            command:
              - /usr/bin/pgrep
              - -f
              - /usr/local/bundle/bin/sensu-client
        env:
          - name: PROMETHEUS_ENDPOINT
            value: prometheus:9090
          - name: SENSU_CLIENT_NAME
            value: ${CLUSTERNAME}
          - name: SENSU_CLIENT_ADDRESS
            value: '${CLUSTERNAME}'
          - name: KUBERNETES_SERVICE_HOST
            value: kubernetes.default
          - name: KUBERNETES_SERVICE_PORT
            value: "443"
        volumeMounts:
          - name: sensu-certs
            mountPath: /etc/sensu/ssl/
          - name: sensu-conf
            mountPath: /etc/sensu/conf.d/connection/
          - name: sensu-config
            mountPath: /etc/sensu/conf.d/client_checks/
          - name: check-prom-config
            mountPath: /etc/sensu/prom/
      volumes:
        - name: sensu-certs
          secret:
            secretName: sensu-certs
        - name: sensu-conf
          secret:
            secretName: sensu-conf
        - name: sensu-config
          configMap:
            name: sensu-config
        - name: check-prom-config
          configMap:
            name: check-prom-config
I’d like to explicitly thank my colleagues Michael Russell, Kevin Struis, Otávio Fernandes, Mitch Hulscher, and the other engineers at Schuberg Philis for all of their hard work developing and implementing this monitoring system.
Thank you for reading! As always our solution is constantly improving as we learn and adapt. Please reach out if you have any feedback or have any challenges with our code!
This is a guest post to the Sensu Blog by Andy Repton, member to the Sensu community. He offered to share his experience as a user in his own words, which you can do too by emailing community@sensu.io.
Related Posts

Monitoring Kubernetes, part 1: the challenges + data sources
The advent of microservices paved the way for container technology, empowering us to rethink how we build and deploy our applications. Docker and Kubernetes, while making it easier for teams to manage containers, also add a level of complexity

How Kubernetes works
This post walks you through how Kubernetes works, breaking down the individual components to illustrate how K8s helps you manage the lifecycle of containerized applications.

Heightened visibility & deeper control with a monitoring control plane
The control plane is a centralized management interface. In this post, Caleb discusses the role of a control plane in monitoring — telling the story of how our users’ need for deep visibility into their applications, and control over their monitoring.

Made with #monitoringlove by SensuTM in Canada 🇨🇦 and the USA 🇺🇸. © 2017-2021 – Privacy Statement – Terms & Conditions