
Kubernetes and its various APIs offer a wealth of information for monitoring and observability. In a recent webinar with the CNCF (as well as a whitepaper based on that webinar), Sensu CEO Caleb Hailey goes in-depth into the most-useful APIs for cloud-native observability. In this post, we’ll focus on the Kubernetes Events API — including why it matters and how it can add context for your observability strategy. We’ll also demo the Sensu Kubernetes Events integration, which makes use of the Kubernetes Events API to give you more context into events.
Observability and the cloud-native journey
“You can’t perform any operation without proper visibility.” — Gene Kim
We’re biased, but we believe observability is of utmost importance when performing any operation, whether that’s driving a car — which can’t be done (safely, at least) if you can’t see through your windshield — or maintaining a complex distributed system.
Observability is also critical in your cloud-native journey; it’s listed as step four in the CNCF trail map, just after “orchestration and application definition.”
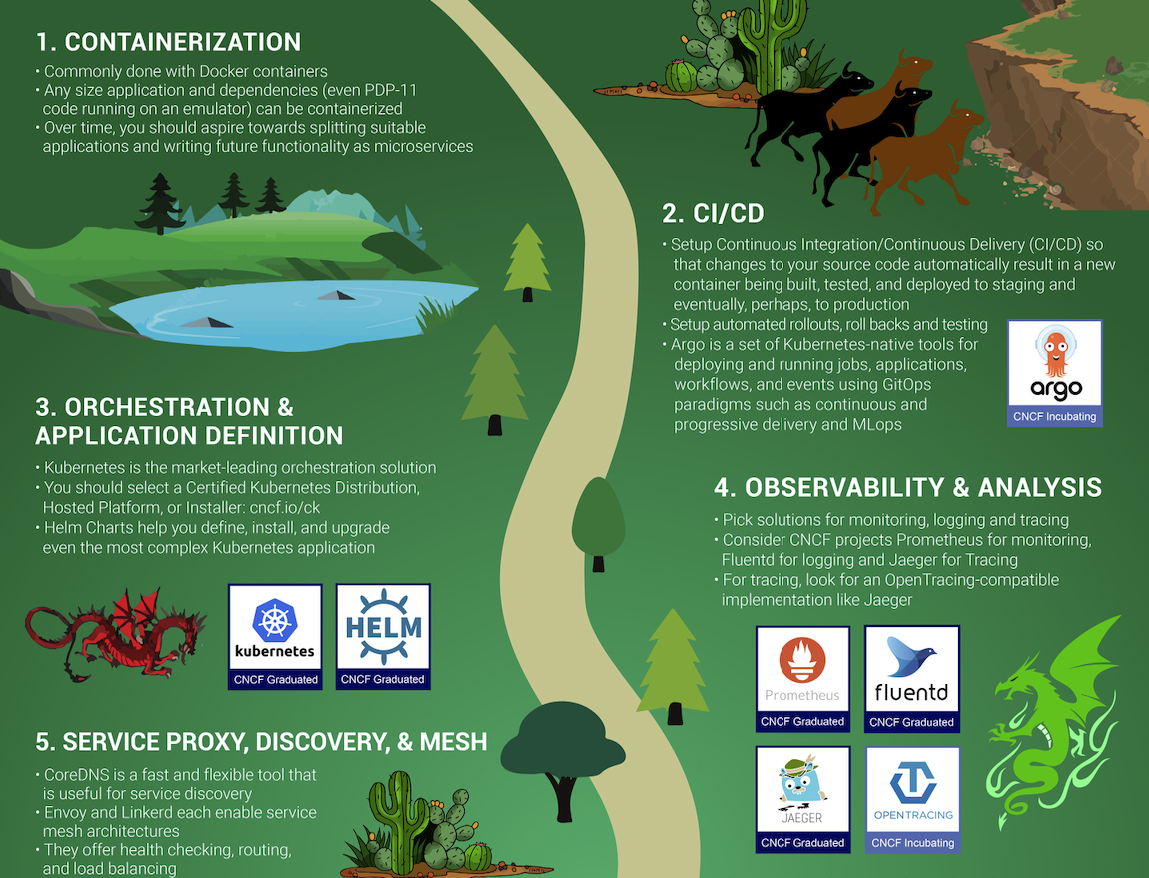 The first few steps of the cloud-native journey, according to the CNCF trail map.
The first step is, understandably, containerization. Once you’ve grokked containers and how they may benefit your business, you can start to produce them as part of the application delivery pipeline — hooking them into CI/CD and testing. When you’re ready to start running them, your orchestration platform of choice is likely Kubernetes. The very next step is observability and analysis.
Observability isn’t only necessary; it should also tell the whole story. You may be familiar with spelunking for context with various kubectl commands (many of which Caleb discusses in his whitepaper on the most-useful Kubernetes APIs for cloud-native observability). If you find yourself overly relying on kubectl to troubleshoot an issue — i.e., you’re too familiar with some of those kubectl commands — that’s a sign there may be gaps in your observability strategy.
In the next few sections, we’ll discuss the Kubernetes Events API — what it is and why it matters — and how you can use those K8s Events to complement your metrics and fill gaps in your observability strategy.
The Kubernetes Events API
The Kubernetes Events API is a first-class Kubernetes resource; just like you can kubectl get pods, you can kubectl get events. These events document state changes, errors, and other messages from other Kubernetes resources or API objects; the information from the Kubernetes Events API is included in the bottom of the output of kubectl describe. For example, perhaps you’ve misconfigured a template, with a typo in an image name, and you’d see image pull or volume mount failures.
The Kubernetes Events API offers the following benefits for observability:
- Serves as the central API for global state changes
- Helps identify underlying problems in Kubernetes
- Offers visibility into loosely coupled events (more on that, below)
- Adds rich context to Kubernetes metrics
Wonder if you might be missing context? Here’s one example, visualized in Grafana:
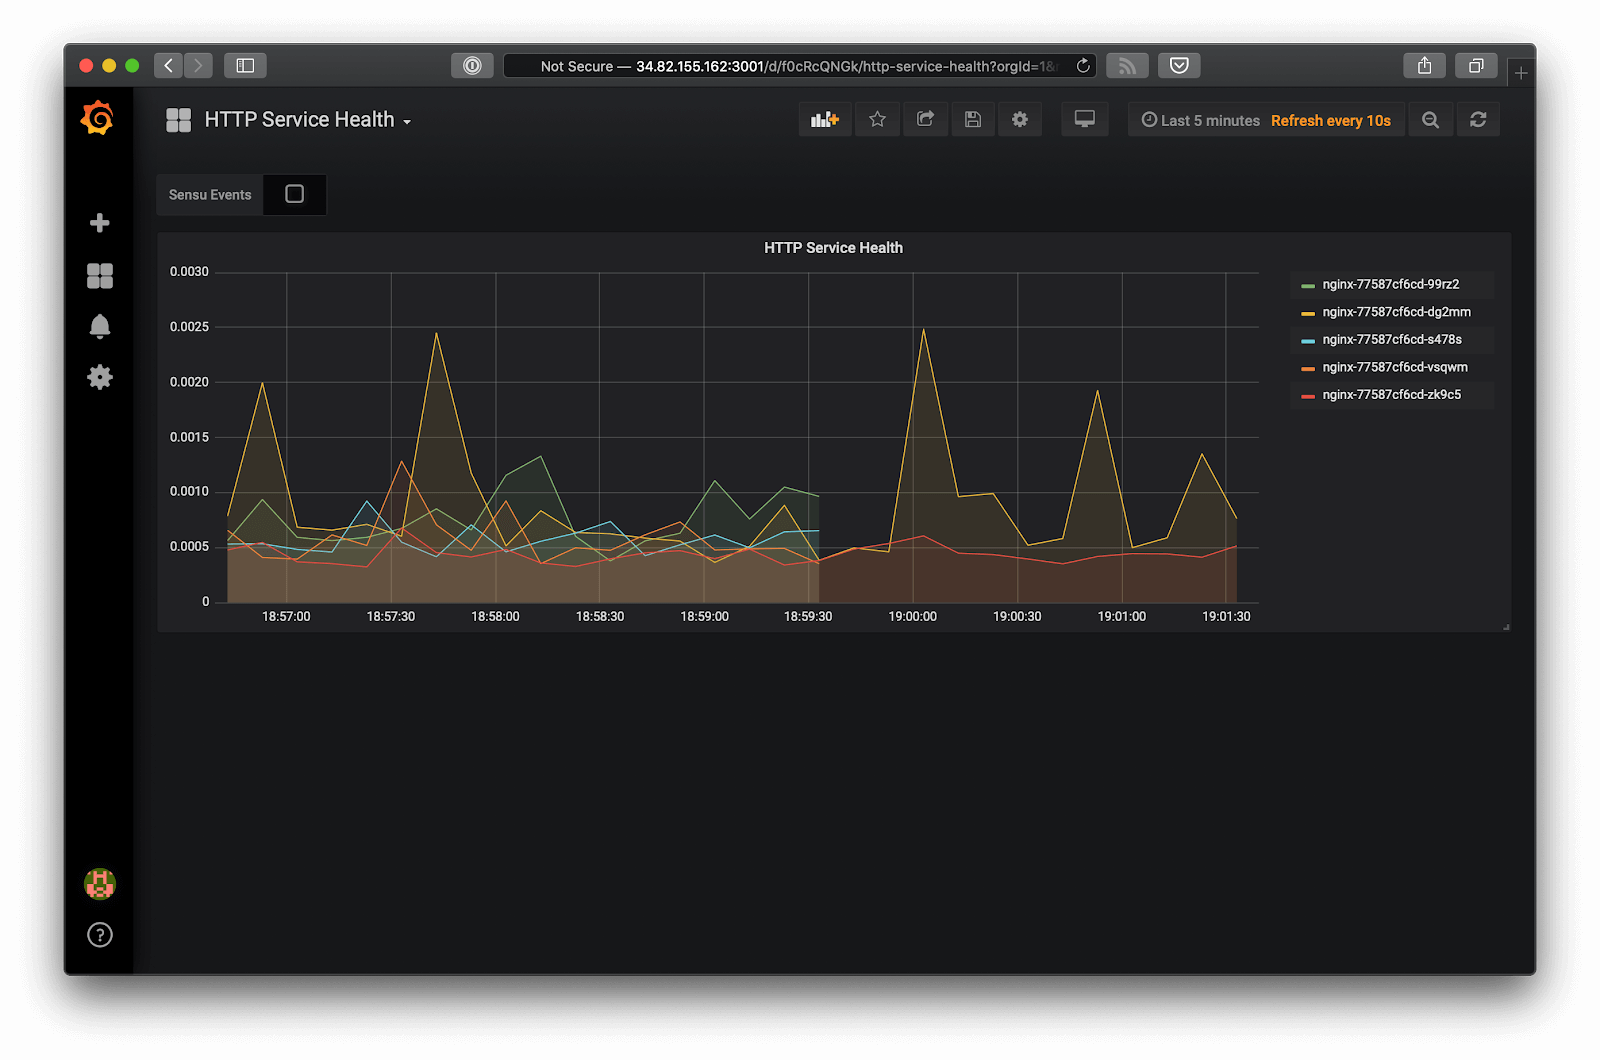 What happened here?
When you see a graph like this, you might have the following questions: Is this normal? Is this a provisioning event? Did a service auto-scale and the number of instances were reduced? Or has some kind of failure occurred?
If you’re taking a purely telemetry-oriented approach to your observability, you might see something like this and not know the difference between normal operations and an anomaly.
Here’s an example of what adding context might look like, via a Grafana annotation.
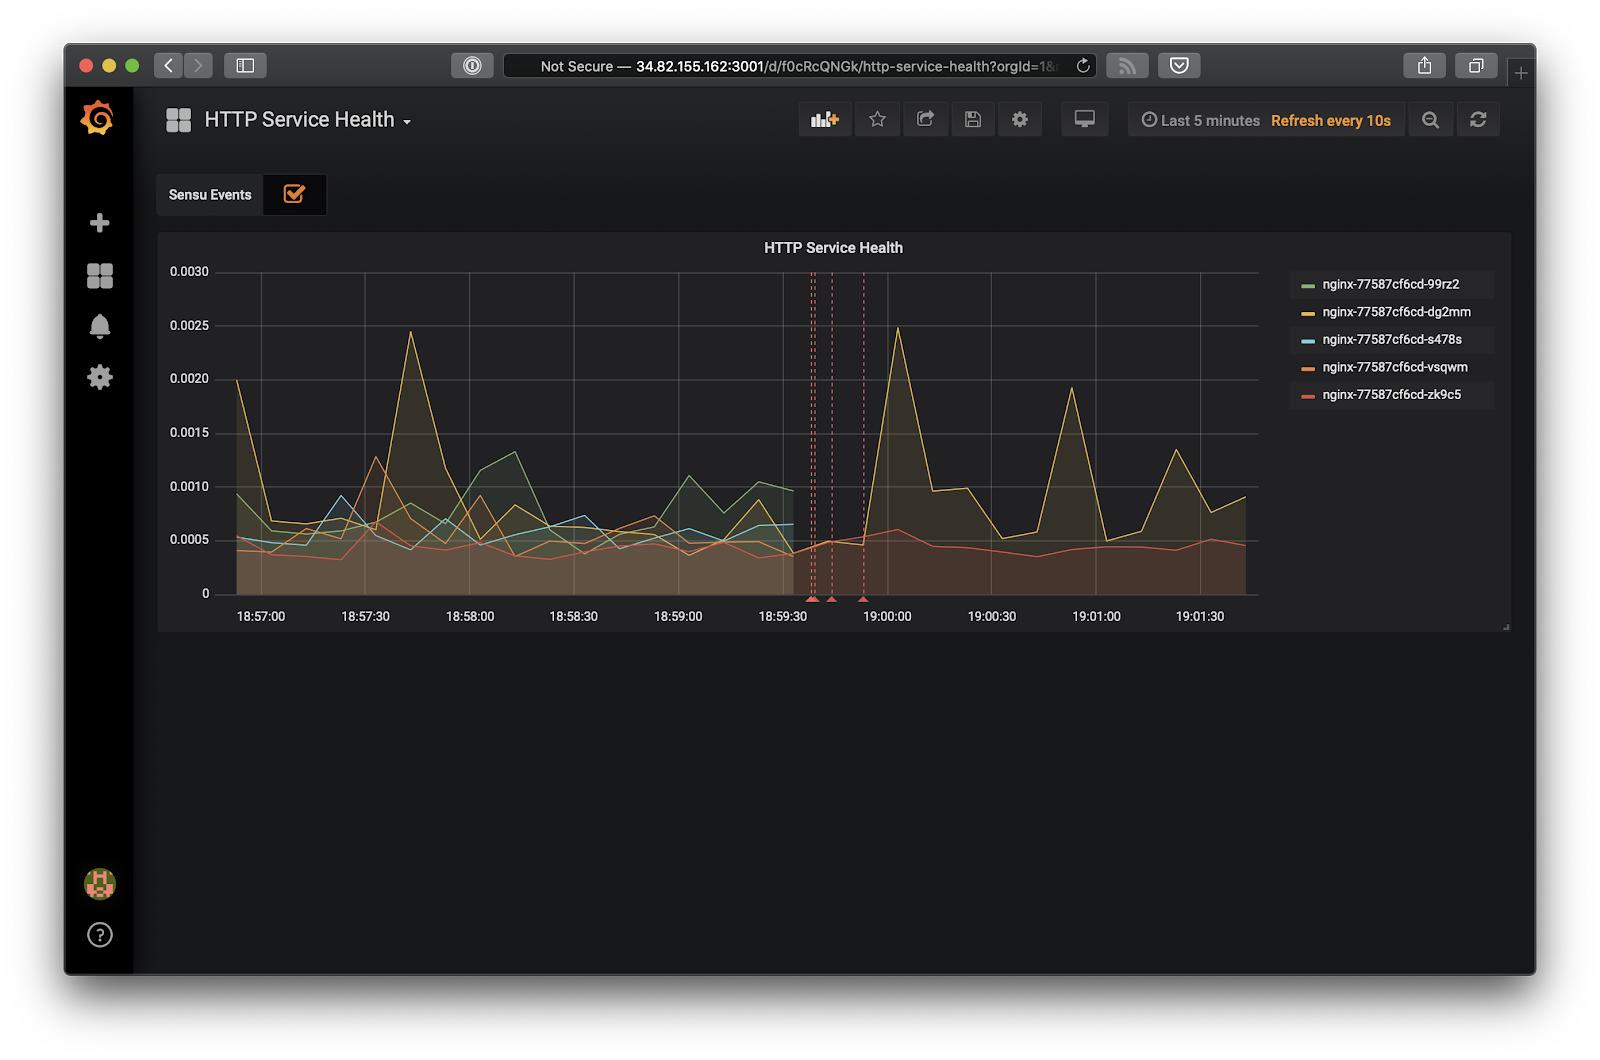
When you click on the annotation, it supplies that much-needed context:
In this example, this isn’t just a normal event (there’s a number of related failures), and the cause needs to be investigated.
Putting the Kubernetes events API into practice with “normal” and “warning” events
The Kubernetes events API includes “normal” and “warning” events. “Normal” events occur when a pod is deployed or an image was pulled successfully.
Should you care about normal events? Is this even observability? Enter our first topic.
What are normal events?
Normal events include:
- Scheduler events (Pod lifecycle). Earlier we mentioned Kubernetes’ loose coupling — you’re not directly managing pods, you’re configuring a controller, which manages a replicaSet, which manages a pod. Even in the normal operation of that chain (even if you think you know how the pod lifecycle works) you might be surprised by how much activity occurs when you perform a simple scaling event, like scaling a resource controller.
- Volume events. Normal provisioning and information about volume IDs presented in normal events.
- Service events. e.g., scaling services get attached to load balancers.
- Underlying node events. You could be scaling the actual Kubernetes cluster itself — adding or removing a kubelet, which will prompt a series of scheduling activities where you may have had some pods running a node that’s been deprovisioned. K8s will automatically replace that workload.
Here are some examples of what these normal events might look like:


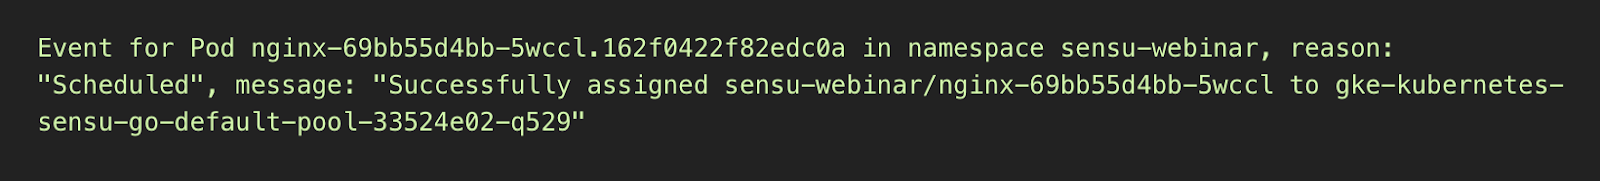
It’s normal before you pull images for Kubernetes to automatically retry, so you’ll often see “Back-off” in these messages. Intermittent failures are typically considered to be “normal” in a distributed system (there’s no connecting the database errors from yesteryear with retries in distributed systems).
The Kubernetes scheduler handles a lot of this out of the box. If you’re not looking at the normal events to understand what Kubernetes is doing, you might be missing out on learning opportunities to improve your systems. For example, you might not be seeing little intermittent failures as part of your application delivery pipeline that Kubernetes is resolving. The Kubernetes scheduler can mask over some of those failures, which may even be failures in your application stack itself, not just the delivery pipeline. These failures could lead to bigger problems down the road that could catch you off guard if you don’t have visibility into normal events.
What are warning events?
It’s possible that you may have encountered events like ErrImagePull, ImagePullBackoff, and CrashLoopBackoff in Kubernetes. We all have — it’s part of the learning process.
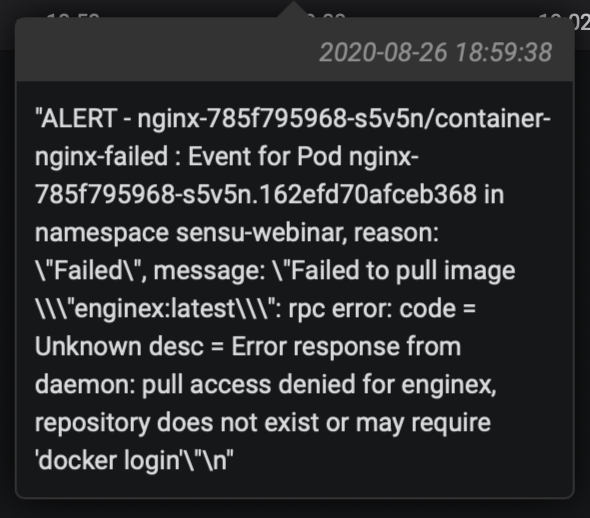
When you drill down and find the underlying event, these events contain the “what” and the “why.” Some of the event messages are quite helpful in telling us what the problem is; in the example below, you can see “nginx” is misspelled.

With this context, we can go right to the source of the image to restore that service.
The new normal of distributed systems provides an opportunity to improve our systems and make them more reliable. Oftentime in a distributed system a normal event (such as retries) precedes a warning event or failure. Correlating normal with warning events provides helpful context. Plus, collecting normal and warning events helps preserve historical data as well as gives you a better understanding of the pod lifecycle.
Demos
Now that we understand the value of both “normal” and warning” events, we’ll share some demos featuring the Kubernetes Events API.
Demo 1
Using kubectl get events you can display the event details, like so:
In the top pane, we’re scaling a deployment. You can see that deployment activity taking place in the kubectl pod list output. Underneath that, there’s a number of “normal” events — creating, deleting, and modifying resources — that we should be capturing as part of our observability solution.
Demo 2
This is showing some of the Kubernetes APIs built in selector capabilities, so you can filter to show the events you’re most interested in. All of those APIs are accessible via kubectl:
$ kubectl get events --field-selector involvedObject.kind!=Pod
Demo 3
To focus on the non-normal or warning events, you’d input:
$ kubectl get events --field-selector type!=Normal
This example shows a warning event from when we tried to deploy the nonexistent “enginex” template. Kubernetes is giving us a ton of context to tell us what the underlying problem is.
Here’s the route we’d use (in our example) to access that exact same data from our applications and services:
$ /api/v1/namespaces/cncf-webinar/events?fieldSelector%21%3DNormal
Which would look something like this:
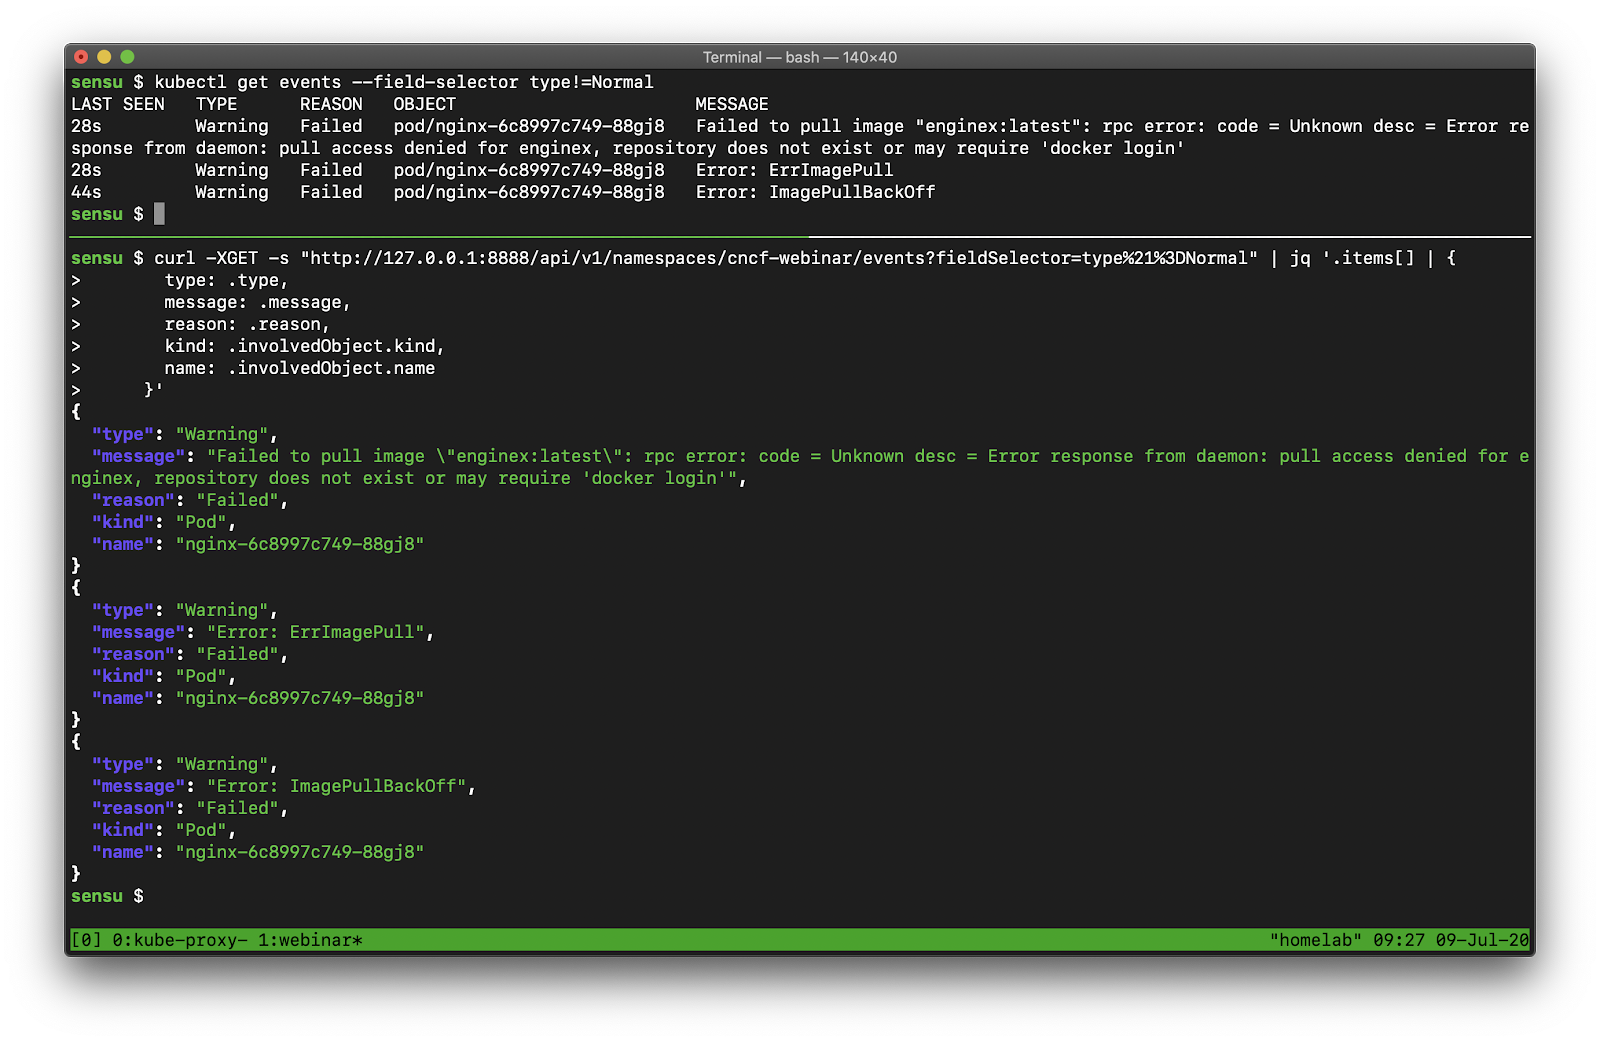
With the data that’s available from kubectl (the CLI tool that’s really just an API client!), we can access from any programming language in the world (or a utility like curl).
If you’re not already collecting this data today, you should start. We recommend you observe normal events until you figure out which ones are not useful inside the context of your organization — with your applications and services, inside of your application delivery pipeline. Turn on the firehose first, and then decide what’s helpful (and not).
That brings us to our new integration.
The Sensu Kubernetes Events integration
The benefits of the Sensu Kubernetes Events integration include:
- Support for both “Normal” and “Warning” events
- Automated correlation of an event with its corresponding Kubernetes resource
- The ability to fine-tune and filter events by “kind,” “type,” and “reason”
- Designed to run as a Kubernetes DaemonSet
- Leverages Sensu round robin subscriptions
To get started deploying the Sensu Kubernetes Events integration, the first thing you need to do is make sure you have the corresponding access to read from that Events API.
Here’s a functional Kubernetes RBAC profile (very similar to Sensu’s own RBAC profiles):
- ClusterRole*: Read-only access to events
- ClusterRoleBinding*: Map to one or more ServiceAccount(s) or Group(s); also works with RoleBindings
- ServiceAccount: Works with a dedicated “Sensu” account, or the K8s “default” account(s)
*Also works with Roles/RoleBindings
Which would look like so:
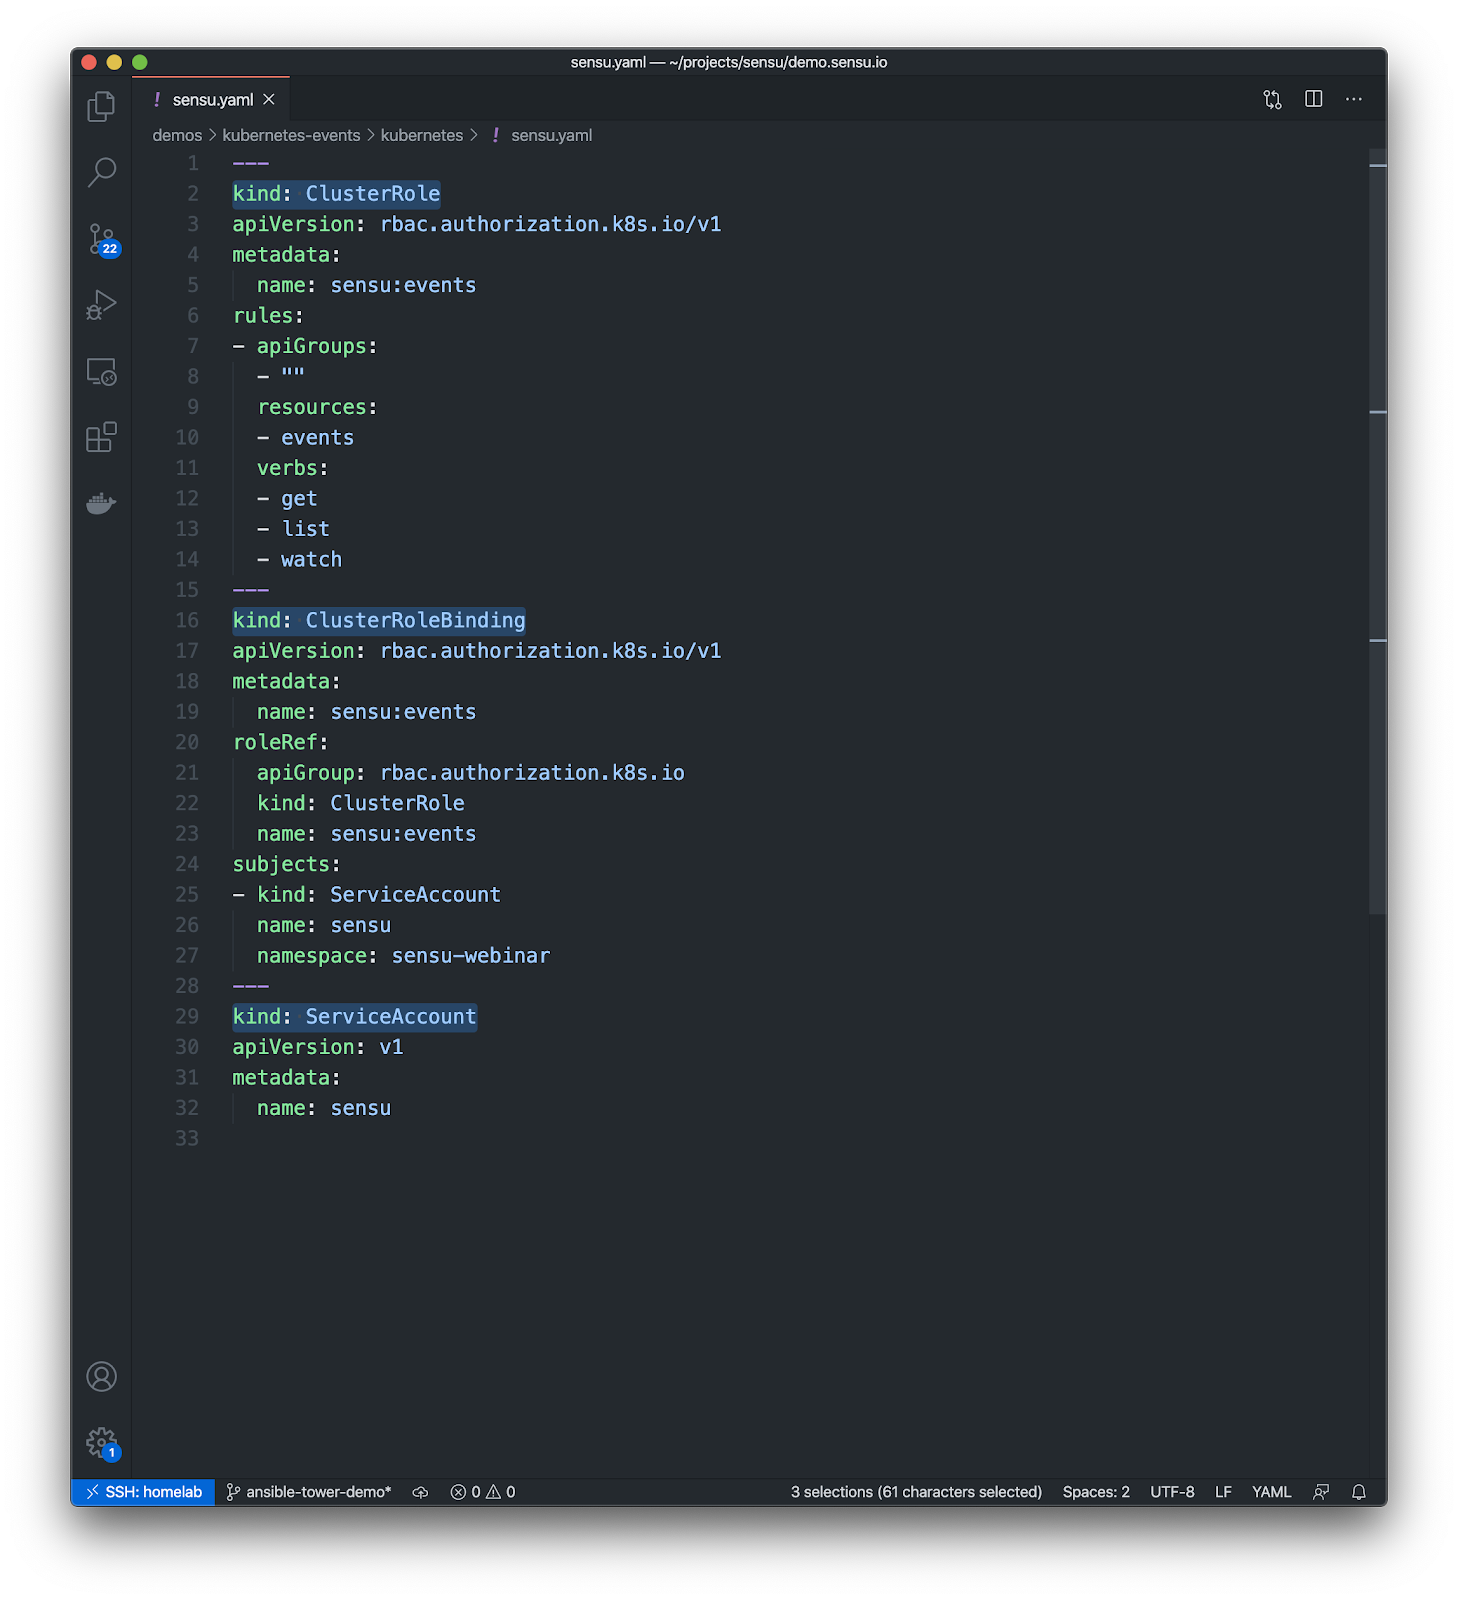
You can modify the built-in RBAC resources, but most Kubernetes deployments will wipe out those changes. The Kubernetes documentation recommends configuring your own custom users (or service accounts, in this case) in the corresponding RBAC file. In this example, we’ve created a read-only role that is a cluster-wide permission. You can use a namespaced role if that’s required (if you only have access to your one namespace), with read-only permissions, and then bind that role to one or more service accounts. Here we’re binding it to our custom Sensu service account. If you’re leveraging the default service account, you can attach this role to multiple subjects, including the default service accounts. You can install this Role and RoleBinding cluster wide using the ClusterRole and ClusterRoleBinding and give the service accounts access, or you can do it on a per-namespace basis.
Here’s a simple demo of the Sensu Kubernetes Events plugin in action:
While creating the demo, it was illuminating to see how creating the same event over and over again inside of Kubernetes would produce failures that you would not have detected if you weren’t collecting this data. While we may have been collecting data from our service all along, without the context coming from the Kubernetes events API, we would have only seen an error that would say something along the lines of: “this service is unreachable.”
We recommend using dynamic runtime assets to get started with the Sensu Kubernetes events plugin. Use the following command to add the asset:
sensuctl asset add sensu/sensu-kubernetes-events
Here’s how a check definition might look:
---

type: CheckConfig
api_version: core/v2
metadata:
  name: sensu-kubernetes-events
  namespace: default
spec:
  command: >-
    sensu-kubernetes-events
    --agent-api-url http://127.0.0.1:3031/events
    --event-type "!=Normal"
subscriptions:
  - system
  runtime_assets:
  - sensu/sensu-kubernetes-events
  stdin: true
  handlers:
  - slack
Keep in mind that the check definition requires stdin to be set to true, and any events created by this check will include the handlers defined for it.
For more usage examples, check out the plugin on Bonsai.
Please note: this plugin is in its early stages of development, and we’d love your feedback! Join our Kubernetes Special Interest Group on Discourse to share your thoughts on this and future Kubernetes integrations.
Context is king
The moral of the story is: don’t settle for metrics alone. Context is critical. Much-needed context can help save a lot of time determining whether an event is an anomaly or normal. To start getting more context into your Kubernetes Events, give our Kubernetes Events integration a try. Last but not least, we invite you to join our Kubernetes SIG on Discourse, where you’ll get exclusive access to pre-releases of future Kubernetes integrations and have an opportunity to share use cases, feedback, and any patterns you’re developing with the Sensu Community.


Made with #monitoringlove by SensuTM in Canada 🇨🇦 and the USA 🇺🇸. © 2017-2021 – Privacy Statement – Terms & Conditions